GNC 2011 Annual Report Download - page 144
Download and view the complete annual report
Please find page 144 of the 2011 GNC annual report below. You can navigate through the pages in the report by either clicking on the pages listed below, or by using the keyword search tool below to find specific information within the annual report.-
 1
1 -
2
-
3
-
4
-
5
-
6
-
7
-
8
-
9
-
10
-
11
-
12
-
13
-
14
-
15
-
16
-
17
-
18
-
19
-
20
-
21
-
22
-
23
-
24
-
25
-
26
-
27
-
28
-
29
-
30
-
31
-
32
-
33
-
34
-
35
-
36
-
37
-
38
-
39
-
40
-
41
-
42
-
43
-
44
-
45
-
46
-
47
-
48
-
49
-
50
-
51
-
52
-
53
-
54
-
55
-
56
-
57
-
58
-
59
-
60
-
61
-
62
-
63
-
64
-
65
-
66
-
67
-
68
-
69
-
70
-
71
-
72
-
73
-
74
-
75
-
76
-
77
-
78
-
79
-
80
-
81
-
82
-
83
-
84
-
85
-
86
-
87
-
88
-
89
-
90
-
91
-
92
-
93
-
94
-
95
-
96
-
97
-
98
-
99
-
100
-
101
-
102
-
103
-
104
-
105
-
106
-
107
-
108
-
109
-
110
-
111
-
112
-
113
-
114
-
115
-
116
-
117
-
118
-
119
-
120
-
121
-
122
-
123
-
124
-
125
-
126
-
127
-
128
-
129
-
130
-
131
-
132
-
133
-
 134
134 -
 135
135 -
 136
136 -
 137
137 -
 138
138 -
 139
139 -
 140
140 -
 141
141 -
 142
142 -
 143
143 -
 144
144 -
 145
145 -
 146
146 -
 147
147 -
 148
148 -
 149
149 -
 150
150 -
 151
151 -
 152
152 -
 153
153 -
 154
154 -
155
-
156
-
157
-
158
-
159
-
160
-
161
-
162
-
163
-
164
-
165
-
166
-
167
-
168
-
169
-
170
-
171
-
172
-
173
-
174
-
175
-
176
-
177
-
178
-
179
-
180
-
181
-
182
-
183
-
184
-
185
-
186
-
187
-
188
-
189
-
190
-
191
-
192
-
193
-
194
-
195
-
196
-
197
-
198
-
199
-
200
-
201
-
202
-
203
-
204
-
205
 |
 |

Table of Contents
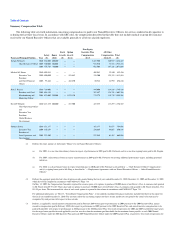
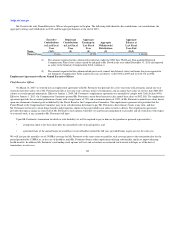
Summary Compensation Table
The following table sets forth information concerning compensation we paid to our Named Executive Officers, for services rendered in all capacities to
us during the last three fiscal years. In accordance with SEC rules, the compensation described in this table does not include medical or group life insurance
received by our Named Executive Officers that are available generally to all of our salaried employees.
Name and Principal Position Year
Salary
($)
Bonus
($)(1)
Stock
Awards
($)
Option
Awards
($)(2)
Non-Equity
Incentive Plan
Compensation
($)(3)
All Other
Compensation
($)(4),(5)
Total
($)
Joseph Fortunato 2010 886,000 100,000 — — 1,107,500 140,919 2,234,419
Chief Executive Officer 2009 860,000 100,000 — — 948,580 72,576 1,981,156
2008 855,769 90,000 — — 928,509 197,326 2,071,604
Michael M. Nuzzo 2010 409,943 — — — 409,943 32,540 852,426
Executive Vice
President
2009 400,000 — — 553,442 335,200 125,321 1,413,963
and Chief Financial
Officer
2008 98,462 — — 462,250 80,542 14,992 656,246
Beth J. Kaplan 2010 716,000 — — — 895,000 134,129 1,745,129
President and Chief 2009 696,154 — — — 767,857 138,755 1,602,766
Merchandising and
Marketing Officer
2008 675,000 250,000 — 1,822,120 732,375 119,770 3,599,265
David P. Berg(6) 2010 427,885 100,000 — 287,500 427,885 113,297 1,356,567
Chief Operating Officer
and
Executive Vice
President,
Global Business
Development
Thomas Dowd 2010 351,177 — — — 351,177 51,677 754,031
Executive Vice
President of
2009 330,154 — — — 276,669 44,015 650,838
Store Operations and
Development
2008 332,500 — — — 271,985 61,419 665,904
Reflects the entire amount set forth under "Bonus" for our Named Executive Officers:
For 2008: (i) a one-time discretionary bonus in respect of performance in 2008 paid to Mr. Fortunato and (ii) a one-time signing bonus paid to Ms. Kaplan.
For 2009: a discretionary bonus in respect of performance in 2009 paid to Mr. Fortunato for meeting additional performance targets, including personnel
initiatives.
For 2010: (i) a discretionary bonus in respect of performance in 2010 paid to Mr. Fortunato as described in "— Chief Executive Officer Compensation";
and (ii) a signing bonus paid to Mr. Berg as described in "— Employment Agreements with our Named Executive Officers — Other Named Executive
Officers".
Reflects the aggregate grant date fair value of option awards granted during the fiscal years ended December 31, 2010, December 31, 2009 and December 31, 2008
which have been computed in accordance with FASB ASC Topic 718.
On May 14, 2009, the Compensation Committee repriced the exercise price of (i) options to purchase 150,000 shares of our Parent's Class A common stock granted
to Mr. Nuzzo from $9.57 to $7.70 per share and (ii) options to purchase 150,000 shares of our Parent's Class A common stock granted to Mr. Nuzzo from $14.35 to
$11.55 per share. The incremental fair value of such stock options is reported in this column in accordance with FASB ASC Topic 718.
For additional information, see Note 18, "Stock-Based Compensation Plans", to our audited consolidated financial statements included elsewhere in this report for
the fiscal year ended December 31, 2010. The amounts reflect the accounting expense for these awards and do not correspond to the actual value that may be
recognized by such persons with respect to these awards.
Reflects, as applicable, annual incentive compensation paid in February 2009 with respect to performance in 2008 pursuant to the 2008 Incentive Plan, annual
incentive compensation paid in February 2010 with respect to performance in 2009 pursuant to the 2009 Incentive Plan, and annual incentive compensation to be
paid in March 2011 with respect to performance in 2010 pursuant to the 2010 Incentive Plan. Our results of operations for 2008 and 2009 exceeded the target goals
for the target bonus payable for each applicable year, but were less than the maximum goal thresholds for the maximum bonus payable, to each 2008 Named
Executive Officer under the 2008 Incentive Plan and each 2009 Named Executive Officer under the 2009 Incentive Plan, respectively. Our results of operations for
(1)
(a)
(b)
(c)
(2)
(3)