GNC 2011 Annual Report Download - page 48
Download and view the complete annual report
Please find page 48 of the 2011 GNC annual report below. You can navigate through the pages in the report by either clicking on the pages listed below, or by using the keyword search tool below to find specific information within the annual report.-
 1
1 -
2
-
3
-
4
-
5
-
6
-
7
-
8
-
9
-
10
-
11
-
12
-
13
-
14
-
15
-
16
-
17
-
18
-
19
-
20
-
21
-
22
-
23
-
24
-
25
-
26
-
27
-
28
-
29
-
30
-
31
-
32
-
33
-
34
-
35
-
36
-
37
-
 38
38 -
 39
39 -
 40
40 -
 41
41 -
 42
42 -
 43
43 -
 44
44 -
 45
45 -
 46
46 -
 47
47 -
 48
48 -
 49
49 -
 50
50 -
 51
51 -
 52
52 -
 53
53 -
 54
54 -
 55
55 -
 56
56 -
 57
57 -
 58
58 -
59
-
60
-
61
-
62
-
63
-
64
-
65
-
66
-
67
-
68
-
69
-
70
-
71
-
72
-
73
-
74
-
75
-
76
-
77
-
78
-
79
-
80
-
81
-
82
-
83
-
84
-
85
-
86
-
87
-
88
-
89
-
90
-
91
-
92
-
93
-
94
-
95
-
96
-
97
-
98
-
99
-
100
-
101
-
102
-
103
-
104
-
105
-
106
-
107
-
108
-
109
-
110
-
111
-
112
-
113
-
114
-
115
-
116
-
117
-
118
-
119
-
120
-
121
-
122
-
123
-
124
-
125
-
126
-
127
-
128
-
129
-
130
-
131
-
132
-
133
-
134
-
135
-
136
-
137
-
138
-
139
-
140
-
141
-
142
-
143
-
144
-
145
-
146
-
147
-
148
-
149
-
150
-
151
-
152
-
153
-
154
-
155
-
156
-
157
-
158
-
159
-
160
-
161
-
162
-
163
-
164
-
165
-
166
-
167
-
168
-
169
-
170
-
171
-
172
-
173
-
174
-
175
-
176
-
177
-
178
-
179
-
180
-
181
-
182
-
183
-
184
-
185
-
186
-
187
-
188
-
189
-
190
-
191
-
192
-
193
-
194
-
195
-
196
-
197
-
198
-
199
-
200
-
201
-
202
-
203
-
204
-
205
 |
 |

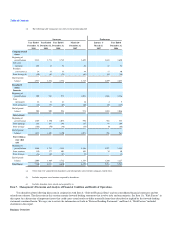
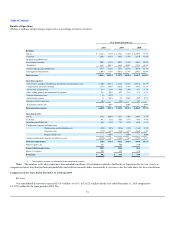
Stockholder's
equity 796.4 717.5 652.1 608.7 312.3
Statement of
Cash Flows:
Net cash provided
by (used in)
operating
activities $ 141.7 $ 114.0 $ 77.4 $ 92.0 $ (50.9) $ 73.6
Net cash used in
investing
activities (36.1) (42.2) (60.4) (1,671.4) (6.2) (23.4)
Net cash (used in)
provided by
financing
activities (30.1) (39.3) (3.4) 1,598.7 42.8 (112.2)
Other Data:
Capital
expenditures(3) $ 32.5 $ 28.7 $ 48.7 $ 28.9 $ 5.7 $ 23.8
Number of stores
(at end of
period)
Company-owned
stores(4) 2,917 2,832 2,774 2,745 2,699 2,688
Franchised
stores(4) 2,340 2,216 2,144 2,056 2,018 2,007
Franchised store-
within-a-store
locations(4) 2,003 1,869 1,712 1,358 1,266 1,227
Other (income) expense includes foreign currency (gain) loss for all of the periods presented. Other (income) expense for the year ended December 31, 2006
includes a $1.2 million loss on the sale of our Australian manufacturing facility.
Working capital represents current assets less current liabilities.
Capital expenditures for the year ended December 31, 2008 include approximately $10.1 million incurred in conjunction with our store register upgrade program.
(1)
(2)
(3) 45