GNC 2011 Annual Report Download - page 111
Download and view the complete annual report
Please find page 111 of the 2011 GNC annual report below. You can navigate through the pages in the report by either clicking on the pages listed below, or by using the keyword search tool below to find specific information within the annual report.-
 1
1 -
2
-
3
-
4
-
5
-
6
-
7
-
8
-
9
-
10
-
11
-
12
-
13
-
14
-
15
-
16
-
17
-
18
-
19
-
20
-
21
-
22
-
23
-
24
-
25
-
26
-
27
-
28
-
29
-
30
-
31
-
32
-
33
-
34
-
35
-
36
-
37
-
38
-
39
-
40
-
41
-
42
-
43
-
44
-
45
-
46
-
47
-
48
-
49
-
50
-
51
-
52
-
53
-
54
-
55
-
56
-
57
-
58
-
59
-
60
-
61
-
62
-
63
-
64
-
65
-
66
-
67
-
68
-
69
-
70
-
71
-
72
-
73
-
74
-
75
-
76
-
77
-
78
-
79
-
80
-
81
-
82
-
83
-
84
-
85
-
86
-
87
-
88
-
89
-
90
-
91
-
92
-
93
-
94
-
95
-
96
-
97
-
98
-
99
-
100
-
 101
101 -
 102
102 -
 103
103 -
 104
104 -
 105
105 -
 106
106 -
 107
107 -
 108
108 -
 109
109 -
 110
110 -
 111
111 -
 112
112 -
 113
113 -
 114
114 -
 115
115 -
 116
116 -
 117
117 -
 118
118 -
 119
119 -
 120
120 -
 121
121 -
122
-
123
-
124
-
125
-
126
-
127
-
128
-
129
-
130
-
131
-
132
-
133
-
134
-
135
-
136
-
137
-
138
-
139
-
140
-
141
-
142
-
143
-
144
-
145
-
146
-
147
-
148
-
149
-
150
-
151
-
152
-
153
-
154
-
155
-
156
-
157
-
158
-
159
-
160
-
161
-
162
-
163
-
164
-
165
-
166
-
167
-
168
-
169
-
170
-
171
-
172
-
173
-
174
-
175
-
176
-
177
-
178
-
179
-
180
-
181
-
182
-
183
-
184
-
185
-
186
-
187
-
188
-
189
-
190
-
191
-
192
-
193
-
194
-
195
-
196
-
197
-
198
-
199
-
200
-
201
-
202
-
203
-
204
-
205
 |
 |
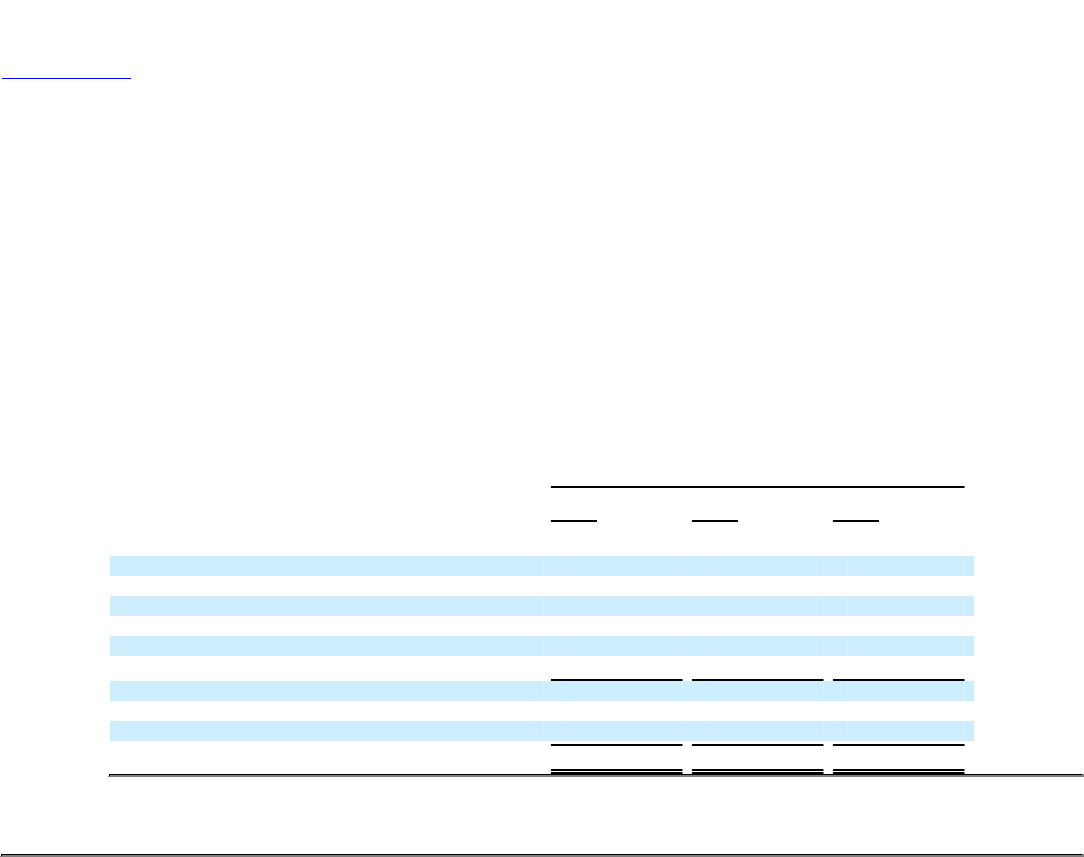
Table of Contents
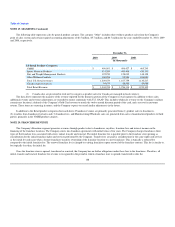
NOTE 19. SEGMENTS
The Company has three reportable segments, each of which represents an identifiable component of the Company for which separate financial
information is available. This information is utilized by management to assess performance and allocate assets accordingly. The Company's management
evaluates segment operating results based on several indicators. The primary key performance indicators are sales and operating income or loss for each
segment. Operating income or loss, as evaluated by management, excludes certain items that are managed at the consolidated level, such as distribution and
warehousing, impairments and other corporate costs. The following table represents key financial information for each of the Company's reportable segments,
identifiable by the distinct operations and management of each: Retail, Franchising, and Manufacturing/Wholesale. The Retail reportable segment includes the
Company's corporate store operations in the United States, Canada and its GNC.com business. The Franchise reportable segment represents the Company's
franchise operations, both domestically and internationally. The Manufacturing/Wholesale reportable segment represents the Company's manufacturing
operations in South Carolina and the Wholesale sales business. This segment supplies the Retail and Franchise segments, along with various third parties, with
finished products for sale. The Warehousing and Distribution and Corporate costs represent the Company's administrative expenses. The accounting policies
of the segments are the same as those described in the "Basis of Presentation and Summary of Significant Accounting Policies".
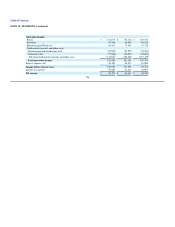
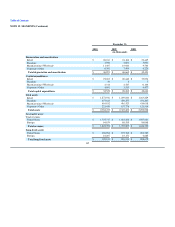
The following table represents key financial information of the Company's segments:
December 31,
2010 2009 2008
(in thousands)
Revenue:
Retail $ 1,344,358 $ 1,256,314 $ 1,219,305
Franchise 293,777 264,168 258,020
Manufacturing/Wholesale:
Intersegment(1) 209,465 201,306 180,070
Third Party 184,261 186,525 179,404
Sub total Manufacturing/Wholesale 393,726 387,831 359,474
Sub total segment revenues 2,031,861 1,908,313 1,836,799
Intersegment elimination(1) (209,465) (201,306) (180,070)
Total revenue $ 1,822,396 $ 1,707,007 $ 1,656,729
Intersegment revenues are eliminated from consolidated revenue.(1) 105