GNC 2011 Annual Report Download - page 55
Download and view the complete annual report
Please find page 55 of the 2011 GNC annual report below. You can navigate through the pages in the report by either clicking on the pages listed below, or by using the keyword search tool below to find specific information within the annual report.-
 1
1 -
2
-
3
-
4
-
5
-
6
-
7
-
8
-
9
-
10
-
11
-
12
-
13
-
14
-
15
-
16
-
17
-
18
-
19
-
20
-
21
-
22
-
23
-
24
-
25
-
26
-
27
-
28
-
29
-
30
-
31
-
32
-
33
-
34
-
35
-
36
-
37
-
38
-
39
-
40
-
41
-
42
-
43
-
44
-
 45
45 -
 46
46 -
 47
47 -
 48
48 -
 49
49 -
 50
50 -
 51
51 -
 52
52 -
 53
53 -
 54
54 -
 55
55 -
 56
56 -
 57
57 -
 58
58 -
 59
59 -
 60
60 -
 61
61 -
 62
62 -
 63
63 -
 64
64 -
 65
65 -
66
-
67
-
68
-
69
-
70
-
71
-
72
-
73
-
74
-
75
-
76
-
77
-
78
-
79
-
80
-
81
-
82
-
83
-
84
-
85
-
86
-
87
-
88
-
89
-
90
-
91
-
92
-
93
-
94
-
95
-
96
-
97
-
98
-
99
-
100
-
101
-
102
-
103
-
104
-
105
-
106
-
107
-
108
-
109
-
110
-
111
-
112
-
113
-
114
-
115
-
116
-
117
-
118
-
119
-
120
-
121
-
122
-
123
-
124
-
125
-
126
-
127
-
128
-
129
-
130
-
131
-
132
-
133
-
134
-
135
-
136
-
137
-
138
-
139
-
140
-
141
-
142
-
143
-
144
-
145
-
146
-
147
-
148
-
149
-
150
-
151
-
152
-
153
-
154
-
155
-
156
-
157
-
158
-
159
-
160
-
161
-
162
-
163
-
164
-
165
-
166
-
167
-
168
-
169
-
170
-
171
-
172
-
173
-
174
-
175
-
176
-
177
-
178
-
179
-
180
-
181
-
182
-
183
-
184
-
185
-
186
-
187
-
188
-
189
-
190
-
191
-
192
-
193
-
194
-
195
-
196
-
197
-
198
-
199
-
200
-
201
-
202
-
203
-
204
-
205
 |
 |

Table of Contents
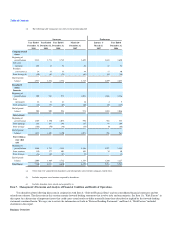
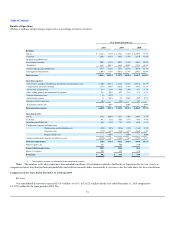
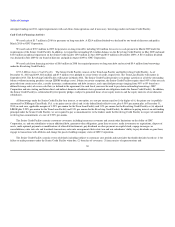
Results of Operations
(Dollars in millions and percentages expressed as a percentage of total net revenues)
Year Ended December 31,
2010 2009 2008
Revenues:
Retail $ 1,344.4 73.8% $ 1,256.3 73.6% $ 1,219.3 73.6%
Franchise 293.8 16.1% 264.2 15.5% 258.0 15.6%
Manufacturing/Wholesale:
Intersegment revenues 209.5 11.5% 201.3 11.8% 180.1 10.9%
Third Party 184.2 10.1% 186.5 10.9% 179.4 10.8%
Subtotal Manufacturing/Wholesale 393.7 21.6% 387.8 22.7% 359.5 21.7%
Intersegment elimination(1) (209.5) -11.5% (201.3) -11.8% (180.1) -10.9%
Total revenues 1,822.4 100.0% 1,707.0 100.0% 1,656.7 100.0%
Operating expenses:
Cost of sales, including warehousing, distribution and occupancy costs 1,180.0 64.8% 1,116.4 65.4% 1,082.6 65.3%
Compensation and related benefits 273.6 15.0% 263.0 15.4% 249.8 15.1%
Advertising and promotion 51.4 2.8% 50.0 2.9% 55.1 3.3%
Other selling, general and administrative expenses 91.8 5.0% 86.7 5.1% 87.8 5.3%
Strategic alternative costs 3.5 0.2% — — — —
Amortization expense 7.8 0.4% 9.8 0.6% 10.9 0.7%
Foreign currency (gain) loss (0.3) — (0.1) — 0.7 —
Transaction related costs — 0.0% — 0.0% — 0.0%
Total operating expenses 1,607.8 88.2% 1,525.8 89.4% 1,486.9 89.7%
Operating income:
Retail 181.9 10.0% 153.1 9.0% 140.9 8.5%
Franchise 95.3 5.2% 80.8 4.7% 80.8 4.9%
Manufacturing/Wholesale 69.4 3.8% 73.5 4.3% 67.4 4.1%
Unallocated corporate and other costs:
Warehousing and distribution costs (55.0) -3.0% (53.6) -3.1% (54.2) -3.3%
Corporate costs (77.0) -4.4% (72.6) -4.3% (65.1) -3.9%
Merger related costs — 0.0% — 0.0% — 0.0%
Subtotal unallocated corporate and other costs, net (132.0) -7.4% (126.2) -7.4% (119.3) -7.2%
Total operating income 214.6 11.6% 181.2 10.6% 169.8 10.3%
Interest expense, net 65.5 70.0 83.0
Income before income taxes 149.1 111.2 86.8
Income tax expense 50.9 41.6 32.0
Net income $ 98.2 $ 69.6 $ 54.8
Intersegment revenues are eliminated from consolidated revenue.(1)
Note: The numbers in the above table have been rounded to millions. All calculations related to the Results of Operations for the year-over-year
comparisons below were derived from unrounded data and could occasionally differ immaterially if you were to use the table above for these calculations.
Comparison of the Years Ended December 31, 2010 and 2009
Revenues
Our consolidated net revenues increased $115.4 million, or 6.8%, to $1,822.4 million for the year ended December 31, 2010 compared to
$1,707.0 million for the same period in 2009. The
51