GNC 2011 Annual Report Download - page 90
Download and view the complete annual report
Please find page 90 of the 2011 GNC annual report below. You can navigate through the pages in the report by either clicking on the pages listed below, or by using the keyword search tool below to find specific information within the annual report.-
 1
1 -
2
-
3
-
4
-
5
-
6
-
7
-
8
-
9
-
10
-
11
-
12
-
13
-
14
-
15
-
16
-
17
-
18
-
19
-
20
-
21
-
22
-
23
-
24
-
25
-
26
-
27
-
28
-
29
-
30
-
31
-
32
-
33
-
34
-
35
-
36
-
37
-
38
-
39
-
40
-
41
-
42
-
43
-
44
-
45
-
46
-
47
-
48
-
49
-
50
-
51
-
52
-
53
-
54
-
55
-
56
-
57
-
58
-
59
-
60
-
61
-
62
-
63
-
64
-
65
-
66
-
67
-
68
-
69
-
70
-
71
-
72
-
73
-
74
-
75
-
76
-
77
-
78
-
79
-
 80
80 -
 81
81 -
 82
82 -
 83
83 -
 84
84 -
 85
85 -
 86
86 -
 87
87 -
 88
88 -
 89
89 -
 90
90 -
 91
91 -
 92
92 -
 93
93 -
 94
94 -
 95
95 -
 96
96 -
 97
97 -
 98
98 -
 99
99 -
 100
100 -
101
-
102
-
103
-
104
-
105
-
106
-
107
-
108
-
109
-
110
-
111
-
112
-
113
-
114
-
115
-
116
-
117
-
118
-
119
-
120
-
121
-
122
-
123
-
124
-
125
-
126
-
127
-
128
-
129
-
130
-
131
-
132
-
133
-
134
-
135
-
136
-
137
-
138
-
139
-
140
-
141
-
142
-
143
-
144
-
145
-
146
-
147
-
148
-
149
-
150
-
151
-
152
-
153
-
154
-
155
-
156
-
157
-
158
-
159
-
160
-
161
-
162
-
163
-
164
-
165
-
166
-
167
-
168
-
169
-
170
-
171
-
172
-
173
-
174
-
175
-
176
-
177
-
178
-
179
-
180
-
181
-
182
-
183
-
184
-
185
-
186
-
187
-
188
-
189
-
190
-
191
-
192
-
193
-
194
-
195
-
196
-
197
-
198
-
199
-
200
-
201
-
202
-
203
-
204
-
205
 |
 |

Table of Contents
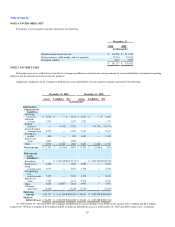
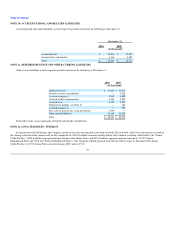
NOTE 4. INVENTORIES, NET
Inventories at each respective period consisted of the following:
December 31,
2010 2009
(in thousands)
Finished product ready for sale $ 319,050 $ 311,422
Work-in-process, bulk product and raw materials 57,165 53,515
Packaging supplies 5,572 5,555
$ 381,787 $ 370,492
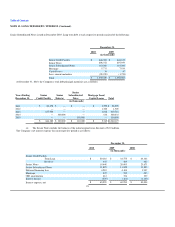
NOTE 5. INCOME TAXES
Deferred income taxes reflect the net tax effects of temporary differences between the carrying amount of assets and liabilities for financial reporting
purposes and the amounts used for income tax purposes.
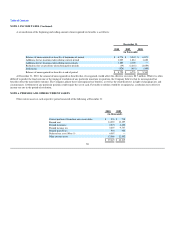
Significant components of the Company's deferred tax assets and liabilities at each respective period consisted of the following:
December 31, 2010 December 31, 2009
Assets Liabilities Net Assets Liabilities Net
(in thousands)
Deferred tax:
Current assets
(liabilities):
Operating
reserves $ 3,018 $ — $ 3,018 $ 2,906 $ — $ 2,906
Deferred
revenue 2,257 — 2,257 1,727 — 1,727
Prepaid
expenses — (7,032) (7,032) — (10,170) (10,170)
Accrued worker
compensation 2,270 — 2,270 2,167 — 2,167
Foreign tax
credits 208 — 208 1,035 — 1,035
Interest rate
swap 1,600 — 1,600 — — —
Other 2,970 (1,284) 1,686 3,401 (1,688) 1,713
Total current $ 12,323 $ (8,316)$ 4,007 $ 11,236 $ (11,858)$ (622)
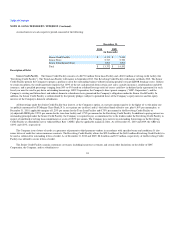
Non-current
assets
(liabilities):
Intangibles $ — $ (312,119)$(312,119) $ — $ (308,724)$(308,724)
Fixed assets 8,285 — 8,285 5,255 — 5,255
Stock
compensation 3,871 — 3,871 2,705 — 2,705
Net operating
loss
carryforwards 7,432 — 7,432 8,100 — 8,100
Interest rate
swap 1,119 — 1,119 5,343 — 5,343
Other 9,882 (2,067) 7,815 5,957 — 5,957
Valuation
allowance (4,418) — (4,418) (7,530) — (7,530)
Total non-
current $ 26,171 $ (314,186)$(288,015) $ 19,830 $ (308,724)$(288,894)
Total net
deferred taxes $ 38,494 $ (322,502)$(284,008) $ 31,066 $ (320,582)$(289,516)
As of December 31, 2010 and 2009, the Company had deferred tax assets relating to state NOLs in the amount of $7.4 million and $8.1 million,
respectively. With the exception of $3.0 million and $0.6 million of deferred tax assets as of December 31, 2010 and 2009, respectively, a valuation
85