GNC 2011 Annual Report Download - page 119
Download and view the complete annual report
Please find page 119 of the 2011 GNC annual report below. You can navigate through the pages in the report by either clicking on the pages listed below, or by using the keyword search tool below to find specific information within the annual report.-
 1
1 -
2
-
3
-
4
-
5
-
6
-
7
-
8
-
9
-
10
-
11
-
12
-
13
-
14
-
15
-
16
-
17
-
18
-
19
-
20
-
21
-
22
-
23
-
24
-
25
-
26
-
27
-
28
-
29
-
30
-
31
-
32
-
33
-
34
-
35
-
36
-
37
-
38
-
39
-
40
-
41
-
42
-
43
-
44
-
45
-
46
-
47
-
48
-
49
-
50
-
51
-
52
-
53
-
54
-
55
-
56
-
57
-
58
-
59
-
60
-
61
-
62
-
63
-
64
-
65
-
66
-
67
-
68
-
69
-
70
-
71
-
72
-
73
-
74
-
75
-
76
-
77
-
78
-
79
-
80
-
81
-
82
-
83
-
84
-
85
-
86
-
87
-
88
-
89
-
90
-
91
-
92
-
93
-
94
-
95
-
96
-
97
-
98
-
99
-
100
-
101
-
102
-
103
-
104
-
105
-
106
-
107
-
108
-
 109
109 -
 110
110 -
 111
111 -
 112
112 -
 113
113 -
 114
114 -
 115
115 -
 116
116 -
 117
117 -
 118
118 -
 119
119 -
 120
120 -
 121
121 -
 122
122 -
 123
123 -
 124
124 -
 125
125 -
 126
126 -
 127
127 -
 128
128 -
 129
129 -
130
-
131
-
132
-
133
-
134
-
135
-
136
-
137
-
138
-
139
-
140
-
141
-
142
-
143
-
144
-
145
-
146
-
147
-
148
-
149
-
150
-
151
-
152
-
153
-
154
-
155
-
156
-
157
-
158
-
159
-
160
-
161
-
162
-
163
-
164
-
165
-
166
-
167
-
168
-
169
-
170
-
171
-
172
-
173
-
174
-
175
-
176
-
177
-
178
-
179
-
180
-
181
-
182
-
183
-
184
-
185
-
186
-
187
-
188
-
189
-
190
-
191
-
192
-
193
-
194
-
195
-
196
-
197
-
198
-
199
-
200
-
201
-
202
-
203
-
204
-
205
 |
 |

Table of Contents
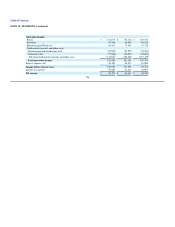
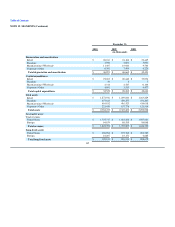
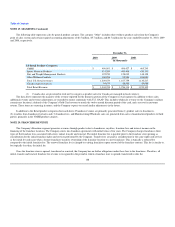
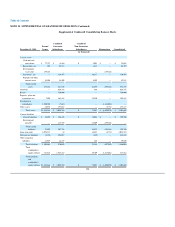
NOTE 25. SUPPLEMENTAL GUARANTOR INFORMATION (Continued)
Supplemental Condensed Consolidating Balance Sheets
December 31, 2010
Parent/
Issuer
Combined
Guarantor
Subsidiaries
Combined
Non-Guarantor
Subsidiaries Eliminations Consolidated
(in thousands)
Current assets
Cash and cash
equivalents $ 148,389 $ (1,985) $ 4,237 $ — $ 150,641
Receivables, net 389 103,886 358 — 104,633
Intercompany
receivables 48,597 — — (48,597) —
Inventories, net — 352,854 28,933 — 381,787
Prepaids and other
current assets 17,153 15,380 7,092 — 39,625
Total current
assets 214,528 470,135 40,620 (48,597) 676,686
Goodwill — 624,773 468 — 625,241
Brands — 720,000 — — 720,000
Property, plant and
equipment, net 7,408 157,967 28,053 — 193,428
Investment in
subsidiaries 1,652,109 (6,957) — (1,645,152) —
Other assets 33,905 141,996 — (8,781) 167,120
Total assets $1,907,950 $ 2,107,914 $ 69,141 $ (1,702,530) $ 2,382,475
Current liabilities
Current liabilities $ 71,391 $ 150,728 $ 11,569 $ — $ 233,688
Intercompany
payables — 29,054 19,543 (48,597) —
Total current
liabilities 71,391 179,782 31,112 (48,597) 233,688
Long-term debt 1,026,563 (268) 12,915 (8,781) 1,030,429
Deferred tax liabilities,
net (4,152) 292,532 (365) — 288,015
Other long-term
liabilities 17,755 14,251 1,944 — 33,950
Total liabilities 1,111,557 486,297 45,606 (57,378) 1,586,082
Total
stockholder's
equity 796,393 1,621,617 23,535 (1,645,152) 796,393
Total liabilities
and
stockholder's
equity $1,907,950 $ 2,107,914 $ 69,141 $ (1,702,530) $ 2,382,475
113