GNC 2011 Annual Report Download - page 121
Download and view the complete annual report
Please find page 121 of the 2011 GNC annual report below. You can navigate through the pages in the report by either clicking on the pages listed below, or by using the keyword search tool below to find specific information within the annual report.-
 1
1 -
2
-
3
-
4
-
5
-
6
-
7
-
8
-
9
-
10
-
11
-
12
-
13
-
14
-
15
-
16
-
17
-
18
-
19
-
20
-
21
-
22
-
23
-
24
-
25
-
26
-
27
-
28
-
29
-
30
-
31
-
32
-
33
-
34
-
35
-
36
-
37
-
38
-
39
-
40
-
41
-
42
-
43
-
44
-
45
-
46
-
47
-
48
-
49
-
50
-
51
-
52
-
53
-
54
-
55
-
56
-
57
-
58
-
59
-
60
-
61
-
62
-
63
-
64
-
65
-
66
-
67
-
68
-
69
-
70
-
71
-
72
-
73
-
74
-
75
-
76
-
77
-
78
-
79
-
80
-
81
-
82
-
83
-
84
-
85
-
86
-
87
-
88
-
89
-
90
-
91
-
92
-
93
-
94
-
95
-
96
-
97
-
98
-
99
-
100
-
101
-
102
-
103
-
104
-
105
-
106
-
107
-
108
-
109
-
110
-
 111
111 -
 112
112 -
 113
113 -
 114
114 -
 115
115 -
 116
116 -
 117
117 -
 118
118 -
 119
119 -
 120
120 -
 121
121 -
 122
122 -
 123
123 -
 124
124 -
 125
125 -
 126
126 -
 127
127 -
 128
128 -
 129
129 -
 130
130 -
 131
131 -
132
-
133
-
134
-
135
-
136
-
137
-
138
-
139
-
140
-
141
-
142
-
143
-
144
-
145
-
146
-
147
-
148
-
149
-
150
-
151
-
152
-
153
-
154
-
155
-
156
-
157
-
158
-
159
-
160
-
161
-
162
-
163
-
164
-
165
-
166
-
167
-
168
-
169
-
170
-
171
-
172
-
173
-
174
-
175
-
176
-
177
-
178
-
179
-
180
-
181
-
182
-
183
-
184
-
185
-
186
-
187
-
188
-
189
-
190
-
191
-
192
-
193
-
194
-
195
-
196
-
197
-
198
-
199
-
200
-
201
-
202
-
203
-
204
-
205
 |
 |

Table of Contents
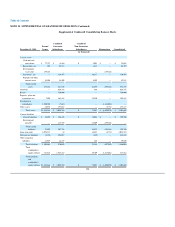
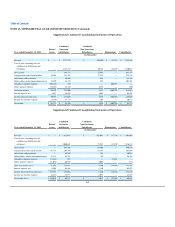
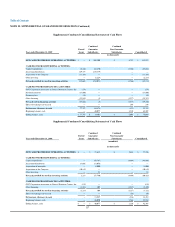
NOTE 25. SUPPLEMENTAL GUARANTOR INFORMATION (Continued)
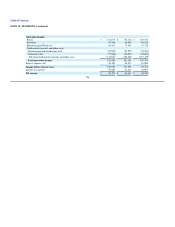
Supplemental Condensed Consolidating Statements of Operations
Year ended December 31, 2010
Parent/
Issuer
Combined
Guarantor
Subsidiaries
Combined
Non-Guarantor
Subsidiaries Eliminations Consolidated
(in thousands)
Revenue $ — $ 1,727,234 $ 108,400 $ (13,238) $ 1,822,396
Cost of sales, including costs of
warehousing, distribution and
occupancy — 1,112,517 80,754 (13,238) 1,180,033
Gross profit — 614,717 27,646 — 642,363
Compensation and related benefits 44,801 211,227 17,551 — 273,579
Advertising and promotion — 50,466 926 — 51,392
Other selling, general and administrative 34,490 68,154 459 — 103,103
Subsidiary (income) expense (101,326) 528 — 100,798 —
Other (income) expense (72,455) 67,336 4,823 — (296)
Operating income 94,490 217,006 3,887 (100,798) 214,585
Interest expense, net 3,512 60,926 1,091 — 65,529
Income before income taxes 90,978 156,080 2,796 (100,798) 149,056
Income tax (benefit) expense (7,195) 57,775 303 — 50,883
Net income $ 98,173 $ 98,305 $ 2,493 $ (100,798) $ 98,173
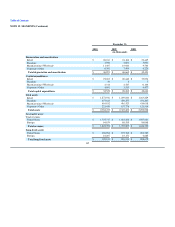
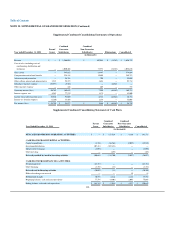
Supplemental Condensed Consolidating Statements of Operations
Year ended December 31, 2009
Parent/
Issuer
Combined
Guarantor
Subsidiaries
Combined
Non-Guarantor
Subsidiaries Eliminations Consolidated
(in thousands)
Revenue $ — $ 1,622,085 $ 102,092 $ (17,170) $ 1,707,007
Cost of sales, including costs of
warehousing, distribution and
occupancy — 1,060,619 72,988 (17,170) 1,116,437
Gross profit — 561,466 29,104 — 590,570
Compensation and related benefits 41,713 205,190 16,143 — 263,046
Advertising and promotion — 49,280 754 — 50,034
Other selling, general and administrative 33,111 63,431 (88) — 96,454
Subsidiary (income) expense (75,141) 997 — 74,144 —
Other (income) expense (71,075) 66,915 4,005 — (155)
Operating income (loss) 71,392 175,653 8,290 (74,144) 181,191
Interest expense, net 4,204 64,569 1,180 — 69,953
Income (loss) before income taxes 67,188 111,084 7,110 (74,144) 111,238
Income tax (benefit) expense (2,431) 41,973 2,077 — 41,619
Net income (loss) $ 69,619 $ 69,111 $ 5,033 $ (74,144) $ 69,619
115