GNC 2011 Annual Report Download - page 75
Download and view the complete annual report
Please find page 75 of the 2011 GNC annual report below. You can navigate through the pages in the report by either clicking on the pages listed below, or by using the keyword search tool below to find specific information within the annual report.-
 1
1 -
2
-
3
-
4
-
5
-
6
-
7
-
8
-
9
-
10
-
11
-
12
-
13
-
14
-
15
-
16
-
17
-
18
-
19
-
20
-
21
-
22
-
23
-
24
-
25
-
26
-
27
-
28
-
29
-
30
-
31
-
32
-
33
-
34
-
35
-
36
-
37
-
38
-
39
-
40
-
41
-
42
-
43
-
44
-
45
-
46
-
47
-
48
-
49
-
50
-
51
-
52
-
53
-
54
-
55
-
56
-
57
-
58
-
59
-
60
-
61
-
62
-
63
-
64
-
 65
65 -
 66
66 -
 67
67 -
 68
68 -
 69
69 -
 70
70 -
 71
71 -
 72
72 -
 73
73 -
 74
74 -
 75
75 -
 76
76 -
 77
77 -
 78
78 -
 79
79 -
 80
80 -
 81
81 -
 82
82 -
 83
83 -
 84
84 -
 85
85 -
86
-
87
-
88
-
89
-
90
-
91
-
92
-
93
-
94
-
95
-
96
-
97
-
98
-
99
-
100
-
101
-
102
-
103
-
104
-
105
-
106
-
107
-
108
-
109
-
110
-
111
-
112
-
113
-
114
-
115
-
116
-
117
-
118
-
119
-
120
-
121
-
122
-
123
-
124
-
125
-
126
-
127
-
128
-
129
-
130
-
131
-
132
-
133
-
134
-
135
-
136
-
137
-
138
-
139
-
140
-
141
-
142
-
143
-
144
-
145
-
146
-
147
-
148
-
149
-
150
-
151
-
152
-
153
-
154
-
155
-
156
-
157
-
158
-
159
-
160
-
161
-
162
-
163
-
164
-
165
-
166
-
167
-
168
-
169
-
170
-
171
-
172
-
173
-
174
-
175
-
176
-
177
-
178
-
179
-
180
-
181
-
182
-
183
-
184
-
185
-
186
-
187
-
188
-
189
-
190
-
191
-
192
-
193
-
194
-
195
-
196
-
197
-
198
-
199
-
200
-
201
-
202
-
203
-
204
-
205
 |
 |

Table of Contents
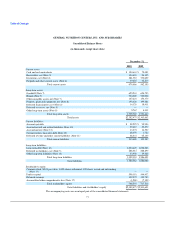
GENERAL NUTRITION CENTERS, INC. AND SUBSIDIARIES
Consolidated Balance Sheets
(in thousands, except share data)
December 31,
2010 2009
Current assets:
Cash and cash equivalents $ 150,641 $ 75,089
Receivables, net (Note 3) 104,633 94,355
Inventories, net (Note 4) 381,787 370,492
Prepaids and other current assets (Note 6) 39,625 42,219
Total current assets 676,686 582,155
Long-term assets:
Goodwill (Note 7) 625,241 624,753
Brands (Note 7) 720,000 720,000
Other intangible assets, net (Note 7) 147,224 154,370
Property, plant and equipment, net (Note 8) 193,428 199,581
Deferred financing fees, net (Note 2) 14,129 18,411
Deferred tax assets, net (Note 5) — —
Other long-term assets (Note 9) 5,767 4,332
Total long-term assets 1,705,789 1,721,447
Total assets $2,382,475 $2,303,602
Current liabilities:
Accounts payable $ 98,295 $ 95,904
Accrued payroll and related liabilities (Note 10) 25,610 22,277
Accrued interest (Note 12) 13,372 14,552
Current portion, long-term debt (Note 12) 28,070 1,724
Deferred revenue and other current liabilities (Note 11) 68,341 65,130
Total current liabilities 233,688 199,587
Long-term liabilities:
Long-term debt (Note 12) 1,030,429 1,058,085
Deferred tax liabilities, net (Note 5) 288,015 288,894
Other long-term liabilities (Note 13) 33,950 39,520
Total long-term liabilities 1,352,394 1,386,499
Total liabilities 1,586,082 1,586,086
Stockholder's equity:
Common stock, $0.01 par value, 1,000 shares authorized, 100 shares issued and outstanding
(Note 17) — —
Paid-in-capital 598,101 594,932
Retained earnings 199,572 129,783
Accumulated other comprehensive loss (Note 17) (1,280) (7,199)
Total stockholder's equity 796,393 717,516
Total liabilities and stockholder's equity $2,382,475 $2,303,602
The accompanying notes are an integral part of the consolidated financial statements.
71