GNC 2011 Annual Report Download - page 14
Download and view the complete annual report
Please find page 14 of the 2011 GNC annual report below. You can navigate through the pages in the report by either clicking on the pages listed below, or by using the keyword search tool below to find specific information within the annual report.-
 1
1 -
2
-
3
-
 4
4 -
 5
5 -
 6
6 -
 7
7 -
 8
8 -
 9
9 -
 10
10 -
 11
11 -
 12
12 -
 13
13 -
 14
14 -
 15
15 -
 16
16 -
 17
17 -
 18
18 -
 19
19 -
 20
20 -
 21
21 -
 22
22 -
 23
23 -
 24
24 -
25
-
26
-
27
-
28
-
29
-
30
-
31
-
32
-
33
-
34
-
35
-
36
-
37
-
38
-
39
-
40
-
41
-
42
-
43
-
44
-
45
-
46
-
47
-
48
-
49
-
50
-
51
-
52
-
53
-
54
-
55
-
56
-
57
-
58
-
59
-
60
-
61
-
62
-
63
-
64
-
65
-
66
-
67
-
68
-
69
-
70
-
71
-
72
-
73
-
74
-
75
-
76
-
77
-
78
-
79
-
80
-
81
-
82
-
83
-
84
-
85
-
86
-
87
-
88
-
89
-
90
-
91
-
92
-
93
-
94
-
95
-
96
-
97
-
98
-
99
-
100
-
101
-
102
-
103
-
104
-
105
-
106
-
107
-
108
-
109
-
110
-
111
-
112
-
113
-
114
-
115
-
116
-
117
-
118
-
119
-
120
-
121
-
122
-
123
-
124
-
125
-
126
-
127
-
128
-
129
-
130
-
131
-
132
-
133
-
134
-
135
-
136
-
137
-
138
-
139
-
140
-
141
-
142
-
143
-
144
-
145
-
146
-
147
-
148
-
149
-
150
-
151
-
152
-
153
-
154
-
155
-
156
-
157
-
158
-
159
-
160
-
161
-
162
-
163
-
164
-
165
-
166
-
167
-
168
-
169
-
170
-
171
-
172
-
173
-
174
-
175
-
176
-
177
-
178
-
179
-
180
-
181
-
182
-
183
-
184
-
185
-
186
-
187
-
188
-
189
-
190
-
191
-
192
-
193
-
194
-
195
-
196
-
197
-
198
-
199
-
200
-
201
-
202
-
203
-
204
-
205
 |
 |

Table of Contents
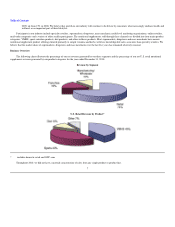
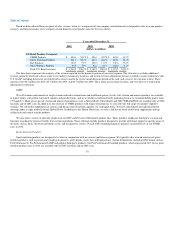
area, and total assets by geographic area, see Note 19, "Segments", to our consolidated financial statements included in this report.
Year ended December 31,
2010 2009 2008
(dollars in millions)
Retail $ 1,344.4 73.8% $ 1,256.3 73.6%$ 1,219.3 73.6%
Franchise 293.8 16.1% 264.2 15.5% 258.0 15.6%
Manufacturing/Wholesale (Third Party) 184.2 10.1% 186.5 10.9% 179.4 10.8%
Total $ 1,822.4 100.0% $ 1,707.0 100.0% $ 1,656.7 100.0%
Retail
Our Retail segment generates revenues primarily from sales of products to customers at our company-owned stores in the United States and Canada,
and in the United States through our website, GNC.com.
Locations
As of December 31, 2010, we operated 2,917 company-owned stores across all 50 states and in Canada, Puerto Rico and Washington, D.C. Most of our
U.S. company owned stores are between 1,000 and 2,000 square feet and are located primarily in shopping malls and strip shopping centers. Traditional
shopping mall and strip shopping center locations generate a large percentage of our total retail sales. With the exception of our downtown stores, virtually all
of our company-owned stores follow one of two consistent formats, one for mall locations and one for strip shopping center locations. We are, however,
developing and testing new store formats to (i) enhance the consumer's shopping experience with a larger and more modern, functional store layout and an
enhanced assortment of merchandise, and (ii) secure major trade area market share with a high visibility, high traffic retail location that builds on the
consumer's perception of the GNC brand as a destination for health and wellness. The new store formats will showcase the GNC brand and will range in size
from approximately 2,000 square feet to 3,000 square feet depending on location. We believe the new store formats will complement our existing 1,500
square foot "modern design" store locations in our traditional real estate locations, such as malls and in-line strip centers.
We periodically redesign our store graphics to better identify with our GNC customers and provide product information to allow the consumer to make
educated decisions regarding product purchases and usage. Our product labeling is consistent within our product lines and the stores are designed to present a
unified approach to packaging with emphasis on added information for the consumer. As an ongoing practice, we continue to reset and upgrade all of our
company owned stores to maintain a more modern and customer friendly layout, while promoting our GNC Live Well® theme.
Franchise
Our Franchise segment is comprised of our domestic and international franchise operations. Our Franchise segment generates revenues from franchise
activities primarily through product sales to franchisees, royalties on franchise retail sales and franchise fees.
As a means of enhancing our operating performance and building our store base, we began opening franchise locations in 1988. As of December 31,
2010, there were 2,340 franchise stores operating, including 903 stores in the United States and 1,437 international franchise stores
12