GNC 2011 Annual Report Download - page 54
Download and view the complete annual report
Please find page 54 of the 2011 GNC annual report below. You can navigate through the pages in the report by either clicking on the pages listed below, or by using the keyword search tool below to find specific information within the annual report.-
 1
1 -
2
-
3
-
4
-
5
-
6
-
7
-
8
-
9
-
10
-
11
-
12
-
13
-
14
-
15
-
16
-
17
-
18
-
19
-
20
-
21
-
22
-
23
-
24
-
25
-
26
-
27
-
28
-
29
-
30
-
31
-
32
-
33
-
34
-
35
-
36
-
37
-
38
-
39
-
40
-
41
-
42
-
43
-
 44
44 -
 45
45 -
 46
46 -
 47
47 -
 48
48 -
 49
49 -
 50
50 -
 51
51 -
 52
52 -
 53
53 -
 54
54 -
 55
55 -
 56
56 -
 57
57 -
 58
58 -
 59
59 -
 60
60 -
 61
61 -
 62
62 -
 63
63 -
 64
64 -
65
-
66
-
67
-
68
-
69
-
70
-
71
-
72
-
73
-
74
-
75
-
76
-
77
-
78
-
79
-
80
-
81
-
82
-
83
-
84
-
85
-
86
-
87
-
88
-
89
-
90
-
91
-
92
-
93
-
94
-
95
-
96
-
97
-
98
-
99
-
100
-
101
-
102
-
103
-
104
-
105
-
106
-
107
-
108
-
109
-
110
-
111
-
112
-
113
-
114
-
115
-
116
-
117
-
118
-
119
-
120
-
121
-
122
-
123
-
124
-
125
-
126
-
127
-
128
-
129
-
130
-
131
-
132
-
133
-
134
-
135
-
136
-
137
-
138
-
139
-
140
-
141
-
142
-
143
-
144
-
145
-
146
-
147
-
148
-
149
-
150
-
151
-
152
-
153
-
154
-
155
-
156
-
157
-
158
-
159
-
160
-
161
-
162
-
163
-
164
-
165
-
166
-
167
-
168
-
169
-
170
-
171
-
172
-
173
-
174
-
175
-
176
-
177
-
178
-
179
-
180
-
181
-
182
-
183
-
184
-
185
-
186
-
187
-
188
-
189
-
190
-
191
-
192
-
193
-
194
-
195
-
196
-
197
-
198
-
199
-
200
-
201
-
202
-
203
-
204
-
205
 |
 |

Table of Contents
and Distribution Agreement (the "Lifelong Agreement"), pursuant to which General Nutrition Corporation and Lifelong will develop a branded line of
supplements to be manufactured by Lifelong. As described above, Mr. Fortino was the Managing Director, a member of the board of directors and a
stockholder of Lifelong's parent company. Products manufactured under the Lifelong Agreement and sold in our stores will be purchased by us from Lifelong;
products sold outside of our stores will be subject to certain revenue sharing arrangements. For the year ended December 31, 2010, we made $1.3 million in
product purchases from Lifelong under the Lifelong Agreement. Effective December 31, 2010, Lifelong's parent company was sold to a third party and
Mr. Fortino resigned his positions at Lifelong.
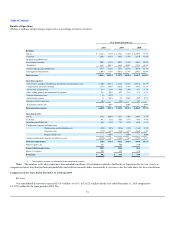
Results of Operations
The following information presented as of December 31, 2010, 2009 and 2008 and for the years then ended was derived from our audited consolidated
financial statements and accompanying notes.
The following information may contain financial measures other than in accordance with generally accepted accounting principles, and should not be
considered in isolation from or as a substitute for our historical consolidated financial statements. In addition, the adjusted combined operating results may not
reflect the actual results we would have achieved absent the adjustments and may not be predictive of future results of operations. We present this information
because we use it to monitor and evaluate our ongoing operating results and trends, and believe it provides investors with an understanding of our operating
performance over comparative periods.
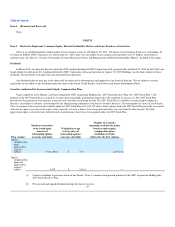
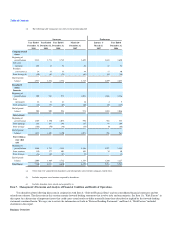
As discussed in Note 19, "Segments", to our consolidated financial statements, we evaluate segment operating results based on several indicators. The
primary key performance indicators are revenues and operating income or loss for each segment. Revenues and operating income or loss, as evaluated by
management, exclude certain items that are managed at the consolidated level, such as warehousing and transportation costs, impairments, and other corporate
costs. The following discussion compares the revenues and the operating income or loss by segment, as well as those items excluded from the segment totals.
Same store sales growth reflects the percentage change in same store sales in the period presented compared to the prior year period. Same store sales
are calculated on a daily basis for each store and exclude the net sales of a store for any period if the store was not open during the same period of the prior
year. We also include our internet sales, as generated through GNC.com and www.drugstore.com, in our domestic company-owned same store sales
calculation. When a store's square footage has been changed as a result of reconfiguration or relocation in the same mall or shopping center, the store
continues to be treated as a same store. If, during the period presented, a store was closed, relocated to a different mall or shopping center, or converted to a
franchise store or a company-owned store, sales from that store up to and including the closing day or the day immediately preceding the relocation or
conversion are included as same store sales as long as the store was open during the same period of the prior year. We exclude from the calculation sales
during the period presented that occurred on or after the date of relocation to a different mall or shopping center or the date of a conversion.
50