GNC 2011 Annual Report Download - page 79
Download and view the complete annual report
Please find page 79 of the 2011 GNC annual report below. You can navigate through the pages in the report by either clicking on the pages listed below, or by using the keyword search tool below to find specific information within the annual report.-
 1
1 -
2
-
3
-
4
-
5
-
6
-
7
-
8
-
9
-
10
-
11
-
12
-
13
-
14
-
15
-
16
-
17
-
18
-
19
-
20
-
21
-
22
-
23
-
24
-
25
-
26
-
27
-
28
-
29
-
30
-
31
-
32
-
33
-
34
-
35
-
36
-
37
-
38
-
39
-
40
-
41
-
42
-
43
-
44
-
45
-
46
-
47
-
48
-
49
-
50
-
51
-
52
-
53
-
54
-
55
-
56
-
57
-
58
-
59
-
60
-
61
-
62
-
63
-
64
-
65
-
66
-
67
-
68
-
 69
69 -
 70
70 -
 71
71 -
 72
72 -
 73
73 -
 74
74 -
 75
75 -
 76
76 -
 77
77 -
 78
78 -
 79
79 -
 80
80 -
 81
81 -
 82
82 -
 83
83 -
 84
84 -
 85
85 -
 86
86 -
 87
87 -
 88
88 -
 89
89 -
90
-
91
-
92
-
93
-
94
-
95
-
96
-
97
-
98
-
99
-
100
-
101
-
102
-
103
-
104
-
105
-
106
-
107
-
108
-
109
-
110
-
111
-
112
-
113
-
114
-
115
-
116
-
117
-
118
-
119
-
120
-
121
-
122
-
123
-
124
-
125
-
126
-
127
-
128
-
129
-
130
-
131
-
132
-
133
-
134
-
135
-
136
-
137
-
138
-
139
-
140
-
141
-
142
-
143
-
144
-
145
-
146
-
147
-
148
-
149
-
150
-
151
-
152
-
153
-
154
-
155
-
156
-
157
-
158
-
159
-
160
-
161
-
162
-
163
-
164
-
165
-
166
-
167
-
168
-
169
-
170
-
171
-
172
-
173
-
174
-
175
-
176
-
177
-
178
-
179
-
180
-
181
-
182
-
183
-
184
-
185
-
186
-
187
-
188
-
189
-
190
-
191
-
192
-
193
-
194
-
195
-
196
-
197
-
198
-
199
-
200
-
201
-
202
-
203
-
204
-
205
 |
 |

Table of Contents
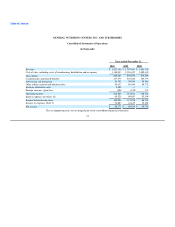
GENERAL NUTRITION CENTERS, INC. AND SUBSIDIARIES
Consolidated Statements of Cash Flows
(in thousands)
Year ended December 31,
2010 2009 2008
CASH FLOWS FROM OPERATING ACTIVITIES:
Net income $ 98,173 $ 69,619 $ 54,780
Adjustments to reconcile net income to net cash provided by operating activities:
Depreciation expense 39,206 36,906 31,562
Amortization of intangible assets 7,787 9,759 10,891
Amortization of deferred financing fees 4,282 4,104 3,907
Amortization of original issue discount 412 374 339
Increase in provision for inventory losses 16,250 11,151 14,406
Non-cash stock-based compensation 3,169 2,855 2,594
(Decrease) increase in provision for losses on accounts receivable (811) (2,540) 253
(Increase) decrease in net deferred taxes (8,132) 21,431 24,371
Changes in assets and liabilities:
Increase in receivables (10,145) (3,488) (5,371)
Increase in inventory, net (26,161) (15,661) (48,248)
Decrease (increase) in other working capital 7,341 6,650 (15,746)
(Decrease) increase in accounts payable 2,338 (28,119) 22,075
Decrease in interest payable (1,180) (1,193) (2,365)
Increase (decrease) in accrued liabilities 9,186 2,109 (16,083)
Net cash provided by operating activities 141,715 113,957 77,365
CASH FLOWS FROM INVESTING ACTIVITIES:
Capital expenditures (32,522) (28,682) (48,666)
Merger of the Company (Note 1) (3,096) (11,268) (10,842)
Franchise store conversions 177 239 404
Acquisition of intangibles — — (1,000)
Store acquisition costs (632) (2,463) (321)
Net cash used in investing activities (36,073) (42,174) (60,425)
CASH FLOWS FROM FINANCING ACTIVITIES:
Return of capital to Parent company — (278) (832)
Dividend payment (28,384) (13,600) —
Borrowings (payments) from revolving credit facility — (5,375) 5,375
Payments on long-term debt (1,721) (19,952) (7,974)
Financing fees — (45) —
Net cash used in financing activities (30,105) (39,250) (3,431)
Effect of exchange rate on cash and cash equivalents 15 249 (56)
Net increase in cash and cash equivalents 75,552 32,782 13,453
Beginning balance, cash and cash equivalents 75,089 42,307 28,854
Ending balance, cash and cash equivalents $ 150,641 $ 75,089 $ 42,307
The accompanying notes are an integral part of the consolidated financial statements.
74