GNC 2011 Annual Report Download - page 60
Download and view the complete annual report
Please find page 60 of the 2011 GNC annual report below. You can navigate through the pages in the report by either clicking on the pages listed below, or by using the keyword search tool below to find specific information within the annual report.-
 1
1 -
2
-
3
-
4
-
5
-
6
-
7
-
8
-
9
-
10
-
11
-
12
-
13
-
14
-
15
-
16
-
17
-
18
-
19
-
20
-
21
-
22
-
23
-
24
-
25
-
26
-
27
-
28
-
29
-
30
-
31
-
32
-
33
-
34
-
35
-
36
-
37
-
38
-
39
-
40
-
41
-
42
-
43
-
44
-
45
-
46
-
47
-
48
-
49
-
 50
50 -
 51
51 -
 52
52 -
 53
53 -
 54
54 -
 55
55 -
 56
56 -
 57
57 -
 58
58 -
 59
59 -
 60
60 -
 61
61 -
 62
62 -
 63
63 -
 64
64 -
 65
65 -
 66
66 -
 67
67 -
 68
68 -
 69
69 -
 70
70 -
71
-
72
-
73
-
74
-
75
-
76
-
77
-
78
-
79
-
80
-
81
-
82
-
83
-
84
-
85
-
86
-
87
-
88
-
89
-
90
-
91
-
92
-
93
-
94
-
95
-
96
-
97
-
98
-
99
-
100
-
101
-
102
-
103
-
104
-
105
-
106
-
107
-
108
-
109
-
110
-
111
-
112
-
113
-
114
-
115
-
116
-
117
-
118
-
119
-
120
-
121
-
122
-
123
-
124
-
125
-
126
-
127
-
128
-
129
-
130
-
131
-
132
-
133
-
134
-
135
-
136
-
137
-
138
-
139
-
140
-
141
-
142
-
143
-
144
-
145
-
146
-
147
-
148
-
149
-
150
-
151
-
152
-
153
-
154
-
155
-
156
-
157
-
158
-
159
-
160
-
161
-
162
-
163
-
164
-
165
-
166
-
167
-
168
-
169
-
170
-
171
-
172
-
173
-
174
-
175
-
176
-
177
-
178
-
179
-
180
-
181
-
182
-
183
-
184
-
185
-
186
-
187
-
188
-
189
-
190
-
191
-
192
-
193
-
194
-
195
-
196
-
197
-
198
-
199
-
200
-
201
-
202
-
203
-
204
-
205
 |
 |

Table of Contents
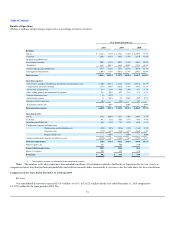
incentive expense; and (4) $1.0 million in other wage related expenditures. In addition, 2008 expenses included a $1.1 million reduction in base wages due to
a change in our vacation policy effective March 31, 2008.
Advertising and promotion. Advertising and promotion expenses decreased $5.1 million, or 9.1%, to $50.0 million for the year ended December 31,
2009 compared to $55.1 million during the same period in 2008. Advertising expense decreased primarily as a result of decreases in media costs of
$2.3 million and print advertising costs of $3.4 million, partially offset by increases in other advertising costs of $0.6 million.
Other SG&A. Other SG&A expenses, including amortization expense, decreased $2.2 million, or 2.3%, to $96.5 million for the year ended
December 31, 2009 compared to $98.7 million for the year ended December 31, 2008. Decreases in bad debt expense of $2.3 million, amortization expense of
$1.2 million and other selling expenses of $0.3 million were partially offset by increases in telecommunications expenses of $1.9 million due to the
installation of a new point of sale register system in 2008 and professional fees of $0.8 million. In addition, other SG&A expenses for the year ended
December 31, 2009 included a $1.1 million gain from proceeds received from the Visa/Mastercard antitrust litigation settlement.
Foreign Currency (Gain) Loss
Foreign currency (gain) loss for the years ended December 31, 2009 and 2008 resulted primarily from accounts payable activity with our Canadian
subsidiary. We recognized income of $0.1 million for the year ended December 31, 2009 and a loss of $0.7 million for the year ended December 31, 2008.
Operating Income
As a result of the foregoing, consolidated operating income increased $11.4 million, or 6.7%, to $181.2 million for the year ended December 31, 2009
compared to $169.8 million for the same period in 2008. Operating income, as a percentage of net revenue, was 10.6% for the year ended December 31, 2009
and 10.3% for the year ended December 31, 2008.
Retail. Operating income increased $12.2 million, or 8.7%, to $153.1 million for the year ended December 31, 2009 compared to $140.9 million for
the same period in 2008. The increase was primarily the result of higher dollar margins on increased sales volumes and reduced advertising spending, partially
offset by increases in occupancy costs, compensation costs and other SG&A expenses.
Franchise. Operating income was unchanged at $80.8 million for each of the years ended December 31, 2009 and 2008.
Manufacturing/Wholesale. Operating income increased $6.1 million, or 9.0%, to $73.5 million for the year ended December 31, 2009 compared to
$67.4 million for the same period in 2008. This increase was primarily the result of increased margins from our South Carolina manufacturing facility,
partially offset by decreases in Rite Aid license fee revenue.
Warehousing and Distribution Costs. Unallocated warehousing and distribution costs decreased $0.6 million, or 1.3%, to $53.6 million for the year
ended December 31, 2009 compared to $54.2 million for the same period in 2008. The decrease was primarily due to decreases in fuel costs.
Corporate Costs. Corporate overhead costs increased $7.5 million, or 11.7%, to $72.6 million for the year ended December 31, 2009 compared to
$65.1 million for the same period in 2008. The
56