Burger King 2006 Annual Report Download - page 93
Download and view the complete annual report
Please find page 93 of the 2006 Burger King annual report below. You can navigate through the pages in the report by either clicking on the pages listed below, or by using the keyword search tool below to find specific information within the annual report.-
 1
1 -
2
-
3
-
4
-
5
-
6
-
7
-
8
-
9
-
10
-
11
-
12
-
13
-
14
-
15
-
16
-
17
-
18
-
19
-
20
-
21
-
22
-
23
-
24
-
25
-
26
-
27
-
28
-
29
-
30
-
31
-
32
-
33
-
34
-
35
-
36
-
37
-
38
-
39
-
40
-
41
-
42
-
43
-
44
-
45
-
46
-
47
-
48
-
49
-
50
-
51
-
52
-
53
-
54
-
55
-
56
-
57
-
58
-
59
-
60
-
61
-
62
-
63
-
64
-
65
-
66
-
67
-
68
-
69
-
70
-
71
-
72
-
73
-
74
-
75
-
76
-
77
-
78
-
79
-
80
-
81
-
82
-
 83
83 -
 84
84 -
 85
85 -
 86
86 -
 87
87 -
 88
88 -
 89
89 -
 90
90 -
 91
91 -
 92
92 -
 93
93 -
 94
94 -
 95
95 -
 96
96 -
 97
97 -
 98
98 -
 99
99 -
 100
100 -
 101
101 -
 102
102 -
 103
103 -
104
-
105
-
106
-
107
-
108
-
109
-
110
-
111
-
112
-
113
-
114
-
115
-
116
-
117
-
118
-
119
-
120
-
121
-
122
-
123
-
124
-
125
-
126
-
127
-
128
-
129
-
130
-
131
 |
 |

BURGER KING HOLDINGS, INC. AND SUBSIDIARIES
Notes to Consolidated Financial Statements Ì (Continued)
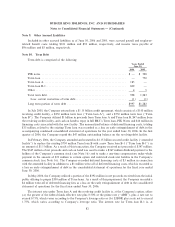
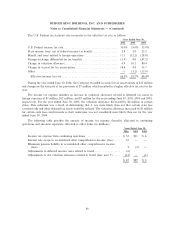
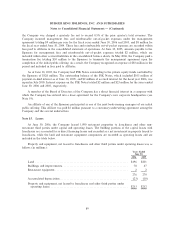
The table below presents intangible assets subject to amortization, along with their useful lives
(in millions):
Years Ended
June 30,
2006 2005
Franchise agreements ÏÏÏÏÏÏÏÏÏÏÏÏÏÏÏÏÏÏÏÏÏÏÏÏÏÏÏÏÏÏÏÏÏÏÏÏ 26 years $ 68 $ 65
Favorable lease contracts ÏÏÏÏÏÏÏÏÏÏÏÏÏÏÏÏÏÏÏÏÏÏÏÏÏÏÏÏÏÏÏÏÏ Up to 20 years 32 36
100 101
Accumulated amortizationÏÏÏÏÏÏÏÏÏÏÏÏÏÏÏÏÏÏÏÏÏÏÏÏÏÏÏÏÏÏÏÏ (21) (15)
Net carrying amount ÏÏÏÏÏÏÏÏÏÏÏÏÏÏÏÏÏÏÏÏÏÏÏÏÏÏÏÏÏÏÏÏÏÏ $ 79 $ 86
Amortization expense on franchise agreements totaled $3 million for the years ended June 30, 2006, 2005
and 2004, respectively. The amortization of favorable lease contracts totaled $4 million for the year ended
June 30, 2006, $3 million for the year ended June 30, 2005, and $5 million for the year ended June 30, 2004.
As of June 30, 2006, estimated future amortization expense of intangible assets subject to amortization
for each of the years ended June 30 is $5 million in 2007; $4 million in each of 2008, 2009, 2010, and 2011;
and $58 million thereafter.
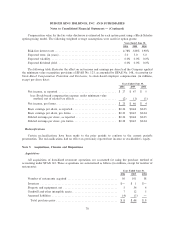
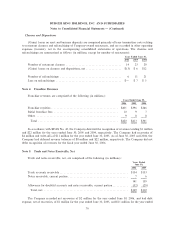
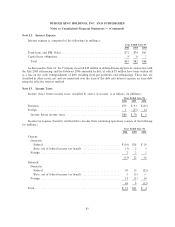
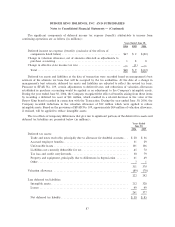
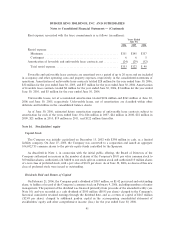
Note 8. Earnings Per Share
Basic and diluted earnings per share were calculated as follows (in millions, except share amounts):
Years Ended June 30,
2006 2005 2004
Numerator:
Numerator for basic and diluted earnings per
share:
Net incomeÏÏÏÏÏÏÏÏÏÏÏÏÏÏÏÏÏÏÏÏÏÏÏÏÏÏÏÏÏÏÏÏ $ 27 $ 47 $ 5
Denominator:
Denominator for basic earnings per share:
Weighted average shares ÏÏÏÏÏÏÏÏÏÏÏÏÏÏÏÏÏÏÏÏÏ 110,327,949 106,499,866 106,061,888
Effect of dilutive securities:
Restricted stock units ÏÏÏÏÏÏÏÏÏÏÏÏÏÏÏÏÏÏÏÏÏ 707,836 410,261 Ì
Employee stock optionsÏÏÏÏÏÏÏÏÏÏÏÏÏÏÏÏÏÏÏÏ 3,654,800 Ì Ì
Denominator for diluted earnings per share ÏÏÏÏÏ 114,690,585 106,910,127 106,061,888
Basic earnings per share ÏÏÏÏÏÏÏÏÏÏÏÏÏÏÏÏÏÏÏÏÏ $ 0.24 $ 0.44 $ 0.05
Diluted earnings per share ÏÏÏÏÏÏÏÏÏÏÏÏÏÏÏÏÏÏÏ $ 0.24 $ 0.44 $ 0.05
Unexercised employee stock options to purchase 1.2 million, 9.0 million and 6.8 million shares of the
Company's common stock for the years ended June 30, 2006, 2005 and 2004, respectively, were not included
in the computation of diluted earnings per share as their exercise prices were equal to or greater than the
average market price of the Company's common stock during those respective periods, which would have
resulted in dilution.
81