Burger King 2006 Annual Report Download - page 45
Download and view the complete annual report
Please find page 45 of the 2006 Burger King annual report below. You can navigate through the pages in the report by either clicking on the pages listed below, or by using the keyword search tool below to find specific information within the annual report.-
 1
1 -
2
-
3
-
4
-
5
-
6
-
7
-
8
-
9
-
10
-
11
-
12
-
13
-
14
-
15
-
16
-
17
-
18
-
19
-
20
-
21
-
22
-
23
-
24
-
25
-
26
-
27
-
28
-
29
-
30
-
31
-
32
-
33
-
34
-
 35
35 -
 36
36 -
 37
37 -
 38
38 -
 39
39 -
 40
40 -
 41
41 -
 42
42 -
 43
43 -
 44
44 -
 45
45 -
 46
46 -
 47
47 -
 48
48 -
 49
49 -
 50
50 -
 51
51 -
 52
52 -
 53
53 -
 54
54 -
 55
55 -
56
-
57
-
58
-
59
-
60
-
61
-
62
-
63
-
64
-
65
-
66
-
67
-
68
-
69
-
70
-
71
-
72
-
73
-
74
-
75
-
76
-
77
-
78
-
79
-
80
-
81
-
82
-
83
-
84
-
85
-
86
-
87
-
88
-
89
-
90
-
91
-
92
-
93
-
94
-
95
-
96
-
97
-
98
-
99
-
100
-
101
-
102
-
103
-
104
-
105
-
106
-
107
-
108
-
109
-
110
-
111
-
112
-
113
-
114
-
115
-
116
-
117
-
118
-
119
-
120
-
121
-
122
-
123
-
124
-
125
-
126
-
127
-
128
-
129
-
130
-
131
 |
 |

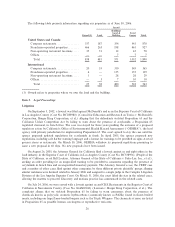
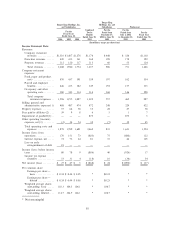
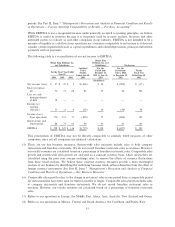
periods. See Part II, Item 7 ""Management's Discussion and Analysis of Financial Condition and Results
of Operations Ì Factors Affecting Comparability of Results Ì Purchase Accounting''.
While EBITDA is not a recognized measure under generally accepted accounting principles, we believe
EBITDA is useful to investors because it is frequently used by security analysts, investors and other
interested parties to evaluate us and other companies in our industry. EBITDA is not intended to be a
measure of liquidity or cash flows from operations nor a measure comparable to net income as it does not
consider certain requirements such as capital expenditures and related depreciation, principal and interest
payments and tax payments.
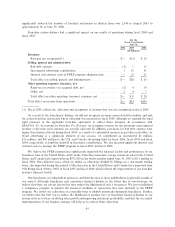
The following table is a reconciliation of our net income to EBITDA:
Burger King
Burger King Holdings, Inc. Holdings, Inc. and
and Subsidiaries Subsidiaries Predecessor
Combined For the For the
Twelve Period from Period from For the
For the Fiscal Year Ended Months December 13, July 1, 2002 Fiscal Year
June 30, Ended June 30, 2002 to June 30, to December 12, Ended June 30,
2006 2005 2004 2003 2003 2002 2002
(In millions)
Net income (loss) $ 27 $ 47 $ 5 $ (868) $ 24 $ (892) $ (37)
Interest expense,
net ÏÏÏÏÏÏÏÏÏÏÏ 72 73 64 81 35 46 105
Loss on early
distinguishment
of debtÏÏÏÏÏÏÏÏ 18 Ì Ì Ì Ì Ì Ì
Income tax
expense
(benefit) ÏÏÏÏÏÏ 53 31 4 (18) 16 (34) 54
Income (loss)
from operations 170 151 73 (805) 75 (880) 122
Depreciation and
amortization ÏÏÏ 88 74 63 86 43 43 161
EBITDAÏÏÏÏÏÏÏÏ $ 258 $ 225 $ 136 $ (719) $ 118 $ (837) $ 283
This presentation of EBITDA may not be directly comparable to similarly titled measures of other
companies, since not all companies use identical calculations.
(5) These are our key business measures. System-wide sales measures include sales at both company
restaurants and franchise restaurants. We do not record franchise restaurant sales as revenues. However,
our royalty revenues are calculated based on a percentage of franchise restaurant sales. Comparable sales
growth and system-wide sales growth are analyzed on a constant currency basis, which means they are
calculated using the prior year average exchange rates, to remove the effects of currency fluctuations
from these trend analyses. We believe these constant currency measures provide a more meaningful
analysis of our business by identifying the underlying business trend, without distortion from the effect of
foreign currency movements. See Part II, Item 7 ""Management's Discussion and Analysis of Financial
Condition and Results of Operations Ì Key Business Measures''.
(6) Comparable sales growth refers to the change in restaurant sales in one period from a comparable period
for restaurants that have been open for thirteen months or longer. Comparable sales growth includes sales
at company restaurants and franchise restaurants. We do not record franchise restaurant sales as
revenues. However, our royalty revenues are calculated based on a percentage of franchise restaurant
sales.
(7) Refers to our operations in Europe, the Middle East, Africa, Asia, Australia, New Zealand and Guam.
(8) Refers to our operations in Mexico, Central and South America, the Caribbean and Puerto Rico.
33