Burger King 2006 Annual Report Download - page 50
Download and view the complete annual report
Please find page 50 of the 2006 Burger King annual report below. You can navigate through the pages in the report by either clicking on the pages listed below, or by using the keyword search tool below to find specific information within the annual report.-
 1
1 -
2
-
3
-
4
-
5
-
6
-
7
-
8
-
9
-
10
-
11
-
12
-
13
-
14
-
15
-
16
-
17
-
18
-
19
-
20
-
21
-
22
-
23
-
24
-
25
-
26
-
27
-
28
-
29
-
30
-
31
-
32
-
33
-
34
-
35
-
36
-
37
-
38
-
39
-
 40
40 -
 41
41 -
 42
42 -
 43
43 -
 44
44 -
 45
45 -
 46
46 -
 47
47 -
 48
48 -
 49
49 -
 50
50 -
 51
51 -
 52
52 -
 53
53 -
 54
54 -
 55
55 -
 56
56 -
 57
57 -
 58
58 -
 59
59 -
 60
60 -
61
-
62
-
63
-
64
-
65
-
66
-
67
-
68
-
69
-
70
-
71
-
72
-
73
-
74
-
75
-
76
-
77
-
78
-
79
-
80
-
81
-
82
-
83
-
84
-
85
-
86
-
87
-
88
-
89
-
90
-
91
-
92
-
93
-
94
-
95
-
96
-
97
-
98
-
99
-
100
-
101
-
102
-
103
-
104
-
105
-
106
-
107
-
108
-
109
-
110
-
111
-
112
-
113
-
114
-
115
-
116
-
117
-
118
-
119
-
120
-
121
-
122
-
123
-
124
-
125
-
126
-
127
-
128
-
129
-
130
-
131
 |
 |
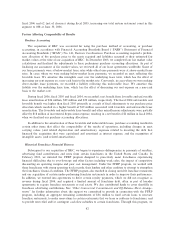
worldwide menu. We expect to leverage our global purchasing power to negotiate lower product costs
and savings for our restaurants outside of the United States and Canada. We believe that the
organizational realignments that we have implemented will position us to execute our global growth
strategy, while remaining responsive to national differences in consumer preferences and local
requirements.
Our Business
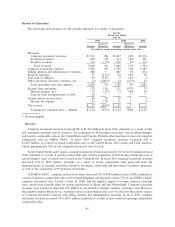
Revenues
We generate revenue from three sources:
‚ sales at our company restaurants;
‚ royalties and franchise fees paid to us by our franchisees; and
‚ property income from restaurants that we lease or sublease to franchisees.
We refer to sales generated at our company restaurants and franchise restaurants as system-wide sales. In
fiscal 2006, franchise restaurants generated approximately 88% of system-wide sales. Royalties paid by
franchisees are based on a percentage of franchise restaurant sales and are recorded as franchise revenues.
Franchise fees and franchise renewal fees are recorded as revenues in the year received. In fiscal 2006,
company restaurant and franchise revenues represented 74% and 21% of total revenues, respectively. The
remaining 5% of total revenues were derived from property income.
We have a higher percentage of franchise restaurants to company restaurants than our major competitors
in the fast food hamburger restaurant category. We believe that this restaurant ownership mix provides us with
a strategic advantage because the capital required to grow and maintain our system is funded primarily by
franchisees while giving us a sizable base of company restaurants to demonstrate credibility with our
franchisees in launching new initiatives. As a result of the high percentage of franchise restaurants in our
system, we have lower capital requirements compared to our major competitors. Moreover, due to the steps
that we have taken to improve the health of our franchise system in the United States and Canada, we expect
that this mix will produce more stable earnings and cash flow in the future. However, our franchise dominated
business model also presents a number of drawbacks, such as our limited control over franchisees and limited
ability to facilitate changes in restaurant ownership.
Revenues are heavily influenced by brand advertising, menu selection and initiatives to improve
restaurant operations. Company restaurant revenues are affected by comparable sales, timing of company
restaurant openings and closings, acquisitions by us of franchise restaurants and sales of company restaurants
to franchisees (""refranchisings''). Royalties are paid to us based on a percentage of franchise restaurant sales,
while franchise fees are paid upon the opening of a new franchise restaurant, or the renewal of an existing
franchise agreement. Our property revenues represent income we earn under leasing and subleasing
arrangements with our franchisees. Royalties, franchise fees and property revenues from franchisees are
affected primarily by sales at franchise restaurants, the timing of franchise restaurant openings and closings
and the financial strength and stability of the franchise system.
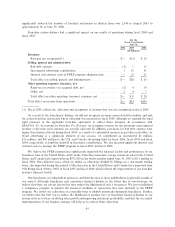
Costs and Expenses
Company restaurants incur three types of operating expenses:
‚ food, paper and product costs, which represent the costs of the food and beverages that we sell to
consumers in company restaurants;
‚ payroll and employee benefits costs, which represent the wages paid to company restaurant managers
and staff, as well as the cost of their health insurance, other benefits and training; and
‚ occupancy and other operating costs, which represent all other direct costs of operating our company
restaurants, including the cost of rent or real estate depreciation (for restaurant properties owned by
us), depreciation on equipment, repairs and maintenance, insurance, restaurant supplies, and utilities.
38