Burger King 2006 Annual Report Download - page 114
Download and view the complete annual report
Please find page 114 of the 2006 Burger King annual report below. You can navigate through the pages in the report by either clicking on the pages listed below, or by using the keyword search tool below to find specific information within the annual report.-
 1
1 -
2
-
3
-
4
-
5
-
6
-
7
-
8
-
9
-
10
-
11
-
12
-
13
-
14
-
15
-
16
-
17
-
18
-
19
-
20
-
21
-
22
-
23
-
24
-
25
-
26
-
27
-
28
-
29
-
30
-
31
-
32
-
33
-
34
-
35
-
36
-
37
-
38
-
39
-
40
-
41
-
42
-
43
-
44
-
45
-
46
-
47
-
48
-
49
-
50
-
51
-
52
-
53
-
54
-
55
-
56
-
57
-
58
-
59
-
60
-
61
-
62
-
63
-
64
-
65
-
66
-
67
-
68
-
69
-
70
-
71
-
72
-
73
-
74
-
75
-
76
-
77
-
78
-
79
-
80
-
81
-
82
-
83
-
84
-
85
-
86
-
87
-
88
-
89
-
90
-
91
-
92
-
93
-
94
-
95
-
96
-
97
-
98
-
99
-
100
-
101
-
102
-
103
-
 104
104 -
 105
105 -
 106
106 -
 107
107 -
 108
108 -
 109
109 -
 110
110 -
 111
111 -
 112
112 -
 113
113 -
 114
114 -
 115
115 -
 116
116 -
 117
117 -
 118
118 -
 119
119 -
 120
120 -
 121
121 -
 122
122 -
 123
123 -
 124
124 -
125
-
126
-
127
-
128
-
129
-
130
-
131
 |
 |

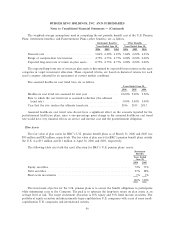
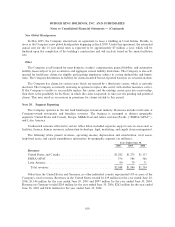
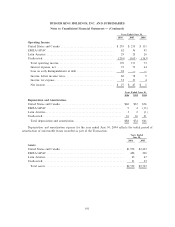
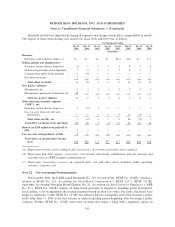
BURGER KING HOLDINGS, INC. AND SUBSIDIARIES
Notes to Consolidated Financial Statements Ì (Continued)
Years Ended
June 30,
2006 2005
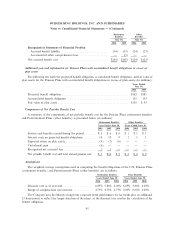
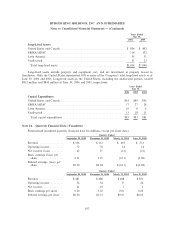
Long-Lived Assets:
United States and Canada ÏÏÏÏÏÏÏÏÏÏÏÏÏÏÏÏÏÏÏÏÏÏÏÏÏÏÏÏÏÏÏÏÏÏÏÏÏÏÏÏÏÏÏÏ $ 854 $ 892
EMEA/APAC ÏÏÏÏÏÏÏÏÏÏÏÏÏÏÏÏÏÏÏÏÏÏÏÏÏÏÏÏÏÏÏÏÏÏÏÏÏÏÏÏÏÏÏÏÏÏÏÏÏÏÏÏÏÏ 114 102
Latin America ÏÏÏÏÏÏÏÏÏÏÏÏÏÏÏÏÏÏÏÏÏÏÏÏÏÏÏÏÏÏÏÏÏÏÏÏÏÏÏÏÏÏÏÏÏÏÏÏÏÏÏÏÏÏ 35 31
UnallocatedÏÏÏÏÏÏÏÏÏÏÏÏÏÏÏÏÏÏÏÏÏÏÏÏÏÏÏÏÏÏÏÏÏÏÏÏÏÏÏÏÏÏÏÏÏÏÏÏÏÏÏÏÏÏÏÏÏ 31 23
Total long-lived assets ÏÏÏÏÏÏÏÏÏÏÏÏÏÏÏÏÏÏÏÏÏÏÏÏÏÏÏÏÏÏÏÏÏÏÏÏÏÏÏÏÏÏÏÏÏÏ $1,034 $1,048
Long-lived assets include property and equipment, net, and net investment in property leased to
franchisees. Only the United States represented 10% or more of the Company's total long-lived assets as of
June 30, 2006 and 2005. Long-lived assets in the United States, including the unallocated portion, totaled
$813 million and $845 million at June 30, 2006 and 2005, respectively.
Years Ended
June 30,
2006 2005 2004
Capital Expenditures:
United States and Canada ÏÏÏÏÏÏÏÏÏÏÏÏÏÏÏÏÏÏÏÏÏÏÏÏÏÏÏÏÏÏÏÏÏÏÏÏÏÏÏÏÏÏÏ $43 $40 $36
EMEA/APAC ÏÏÏÏÏÏÏÏÏÏÏÏÏÏÏÏÏÏÏÏÏÏÏÏÏÏÏÏÏÏÏÏÏÏÏÏÏÏÏÏÏÏÏÏÏÏÏÏÏÏÏÏ 17 27 28
Latin AmericaÏÏÏÏÏÏÏÏÏÏÏÏÏÏÏÏÏÏÏÏÏÏÏÏÏÏÏÏÏÏÏÏÏÏÏÏÏÏÏÏÏÏÏÏÏÏÏÏÏÏÏÏÏ 10 8 6
Unallocated ÏÏÏÏÏÏÏÏÏÏÏÏÏÏÏÏÏÏÏÏÏÏÏÏÏÏÏÏÏÏÏÏÏÏÏÏÏÏÏÏÏÏÏÏÏÏÏÏÏÏÏÏÏÏÏ 15 18 11
Total capital expenditures ÏÏÏÏÏÏÏÏÏÏÏÏÏÏÏÏÏÏÏÏÏÏÏÏÏÏÏÏÏÏÏÏÏÏÏÏÏÏÏÏÏ $85 $93 $81
Note 21. Quarterly Financial Data (Unaudited)
Summarized unaudited quarterly financial data (in millions, except per share data)
Quarters Ended
September 30, 2005 December 31, 2005 March 31, 2006 June 30, 2006
Revenue ÏÏÏÏÏÏÏÏÏÏÏÏÏÏÏÏÏ $ 508 $ 512 $ 495 $ 533
Operating incomeÏÏÏÏÏÏÏÏÏÏ 72 70 14 14
Net income (loss) ÏÏÏÏÏÏÏÏÏ 22 27 (12) (10)
Basic earnings (loss) per
share ÏÏÏÏÏÏÏÏÏÏÏÏÏÏÏÏÏÏ 0.21 0.25 (0.11) (0.08)
Diluted earnings (loss) per
share ÏÏÏÏÏÏÏÏÏÏÏÏÏÏÏÏÏÏ $0.20 $0.24 $(0.11) $(0.08)
Quarters Ended
September 30, 2004 December 31, 2004 March 31, 2005 June 30, 2005
Revenue ÏÏÏÏÏÏÏÏÏÏÏÏÏÏÏÏÏ $ 481 $ 488 $ 468 $ 503
Operating incomeÏÏÏÏÏÏÏÏÏÏ 56 54 17 24
Net incomeÏÏÏÏÏÏÏÏÏÏÏÏÏÏÏ 21 23 1 2
Basic earnings per share ÏÏÏÏ 0.20 0.22 0.01 0.02
Diluted earnings per share ÏÏ $0.20 $0.21 $0.01 $0.02
102