Burger King 2006 Annual Report Download - page 65
Download and view the complete annual report
Please find page 65 of the 2006 Burger King annual report below. You can navigate through the pages in the report by either clicking on the pages listed below, or by using the keyword search tool below to find specific information within the annual report.-
 1
1 -
2
-
3
-
4
-
5
-
6
-
7
-
8
-
9
-
10
-
11
-
12
-
13
-
14
-
15
-
16
-
17
-
18
-
19
-
20
-
21
-
22
-
23
-
24
-
25
-
26
-
27
-
28
-
29
-
30
-
31
-
32
-
33
-
34
-
35
-
36
-
37
-
38
-
39
-
40
-
41
-
42
-
43
-
44
-
45
-
46
-
47
-
48
-
49
-
50
-
51
-
52
-
53
-
54
-
 55
55 -
 56
56 -
 57
57 -
 58
58 -
 59
59 -
 60
60 -
 61
61 -
 62
62 -
 63
63 -
 64
64 -
 65
65 -
 66
66 -
 67
67 -
 68
68 -
 69
69 -
 70
70 -
 71
71 -
 72
72 -
 73
73 -
 74
74 -
 75
75 -
76
-
77
-
78
-
79
-
80
-
81
-
82
-
83
-
84
-
85
-
86
-
87
-
88
-
89
-
90
-
91
-
92
-
93
-
94
-
95
-
96
-
97
-
98
-
99
-
100
-
101
-
102
-
103
-
104
-
105
-
106
-
107
-
108
-
109
-
110
-
111
-
112
-
113
-
114
-
115
-
116
-
117
-
118
-
119
-
120
-
121
-
122
-
123
-
124
-
125
-
126
-
127
-
128
-
129
-
130
-
131
 |
 |

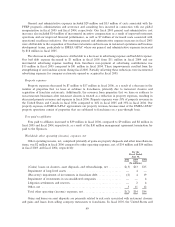
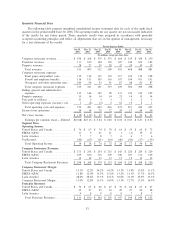
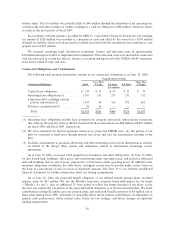
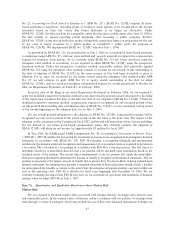
For the Quarters Ended
Jun 30, Mar 31, Dec 31, Sep 30, Jun 30, Mar 31, Dec 31, Sep 30,
2006 2006 2005 2005 2005 2005 2004 2004
(In millions, except per share data)
Franchise Sales:
United States and Canada ÏÏÏÏÏÏÏÏÏÏÏÏÏ $1,914 $1,795 $1,850 $1,923 $1,956 $1,761 $1,877 $1,961
EMEA/APACÏÏÏÏÏÏÏÏÏÏÏÏÏÏÏÏÏÏÏÏÏÏÏ 695 632 680 708 671 640 667 662
Latin America ÏÏÏÏÏÏÏÏÏÏÏÏÏÏÏÏÏÏÏÏÏÏÏ 187 172 179 168 163 153 159 147
Total Franchise Sales ÏÏÏÏÏÏÏÏÏÏÏÏÏÏÏ $2,796 $2,599 $2,709 $2,799 $2,790 $2,554 $2,703 $2,770
Restaurant sales are affected by the timing and effectiveness of our advertising, new products and
promotional programs. Our results of operations also fluctuate from quarter to quarter as a result of seasonal
trends and other factors, such as the timing of restaurant openings and closings and our acquisition of franchise
restaurants as well as variability of the weather. Restaurant sales are typically higher in our fourth and first
fiscal quarters, which are the spring and summer months when weather is warmer, than in our second and
third fiscal quarters, which are the fall and winter months. Restaurant sales during the winter are typically
highest in December, during the holiday shopping season. Our restaurant sales and company restaurant
margins are typically lowest during our third fiscal quarter, which occurs during the winter months and
includes February, the shortest month of the year.
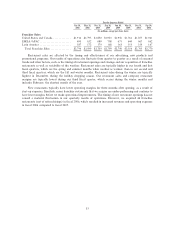
New restaurants typically have lower operating margins for three months after opening, as a result of
start-up expenses. Similarly, many franchise restaurants that we acquire are under-performing and continue to
have lower margins before we make operational improvements. The timing of new restaurant openings has not
caused a material fluctuation in our quarterly results of operations. However, we acquired 44 franchise
restaurants (net of refranchisings) in fiscal 2006, which resulted in increased revenues and operating expenses
in fiscal 2006 compared to fiscal 2005.
53