Burger King 2006 Annual Report Download - page 64
Download and view the complete annual report
Please find page 64 of the 2006 Burger King annual report below. You can navigate through the pages in the report by either clicking on the pages listed below, or by using the keyword search tool below to find specific information within the annual report.-
 1
1 -
2
-
3
-
4
-
5
-
6
-
7
-
8
-
9
-
10
-
11
-
12
-
13
-
14
-
15
-
16
-
17
-
18
-
19
-
20
-
21
-
22
-
23
-
24
-
25
-
26
-
27
-
28
-
29
-
30
-
31
-
32
-
33
-
34
-
35
-
36
-
37
-
38
-
39
-
40
-
41
-
42
-
43
-
44
-
45
-
46
-
47
-
48
-
49
-
50
-
51
-
52
-
53
-
 54
54 -
 55
55 -
 56
56 -
 57
57 -
 58
58 -
 59
59 -
 60
60 -
 61
61 -
 62
62 -
 63
63 -
 64
64 -
 65
65 -
 66
66 -
 67
67 -
 68
68 -
 69
69 -
 70
70 -
 71
71 -
 72
72 -
 73
73 -
 74
74 -
75
-
76
-
77
-
78
-
79
-
80
-
81
-
82
-
83
-
84
-
85
-
86
-
87
-
88
-
89
-
90
-
91
-
92
-
93
-
94
-
95
-
96
-
97
-
98
-
99
-
100
-
101
-
102
-
103
-
104
-
105
-
106
-
107
-
108
-
109
-
110
-
111
-
112
-
113
-
114
-
115
-
116
-
117
-
118
-
119
-
120
-
121
-
122
-
123
-
124
-
125
-
126
-
127
-
128
-
129
-
130
-
131
 |
 |

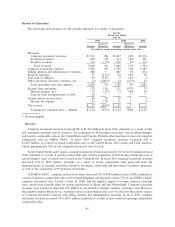
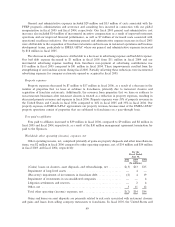
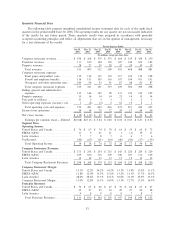
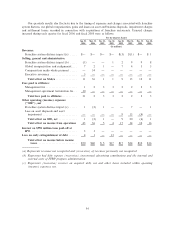
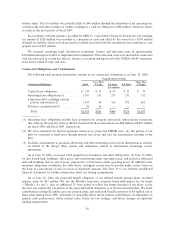
Quarterly Financial Data
The following table presents unaudited consolidated income statement data for each of the eight fiscal
quarters in the period ended June 30, 2006. The operating results for any quarter are not necessarily indicative
of the results for any future period. These quarterly results were prepared in accordance with generally
accepted accounting principles and reflect all adjustments that are, in the opinion of management, necessary
for a fair statement of the results.
For the Quarters Ended
Jun 30, Mar 31, Dec 31, Sep 30, Jun 30, Mar 31, Dec 31, Sep 30,
2006 2006 2005 2005 2005 2005 2004 2004
(In millions, except per share data)
Company restaurant revenues ÏÏÏÏÏÏÏÏÏÏ $ 394 $ 368 $ 379 $ 375 $ 364 $ 339 $ 354 $ 350
Franchise revenues ÏÏÏÏÏÏÏÏÏÏÏÏÏÏÏÏÏÏÏ 111 100 104 105 107 100 104 102
Property revenues ÏÏÏÏÏÏÏÏÏÏÏÏÏÏÏÏÏÏÏÏ 28 27 29 28 32 29 30 29
Total revenues ÏÏÏÏÏÏÏÏÏÏÏÏÏÏÏÏÏÏÏÏÏ 533 495 512 508 503 468 488 481
Company restaurant expenses:
Food, paper and product costs ÏÏÏÏÏÏÏÏ 119 114 119 118 115 104 110 108
Payroll and employee benefits ÏÏÏÏÏÏÏÏ 116 111 109 110 107 104 101 103
Occupancy and other operating costs ÏÏ 100 96 93 91 87 88 81 87
Total company restaurant expenses ÏÏÏÏ 335 321 321 319 309 296 292 298
Selling, general and administrative
expenses ÏÏÏÏÏÏÏÏÏÏÏÏÏÏÏÏÏÏÏÏÏÏÏÏÏÏ 135 146 109 98 131 124 123 109
Property expenses ÏÏÏÏÏÏÏÏÏÏÏÏÏÏÏÏÏÏÏÏ 15 14 14 14 21 14 15 14
Fees paid to affiliates ÏÏÏÏÏÏÏÏÏÏÏÏÏÏÏÏÏ 31 2332223
Other operating expenses (income), netÏÏ 3 (2) (5) 2 16 15 2 1
Total operating costs and expenses ÏÏÏÏ 519 481 442 436 479 451 434 425
Income from operations ÏÏÏÏÏÏÏÏÏÏÏÏÏÏÏ 14 14 70 72 24 17 54 56
Net (loss) income ÏÏÏÏÏÏÏÏÏÏÏÏÏÏÏÏÏÏÏÏ $ (10) $ (12) $ 27 $ 22 $ 2 $ 1 $ 23 $ 21
Earnings per common share Ì Diluted $(0.08) $(0.11) $ 0.24 $ 0.20 $ 0.02 $ 0.01 $ 0.21 $ 0.20
Segment Data
Operating Income:
United States and Canada ÏÏÏÏÏÏÏÏÏÏÏÏÏ $ 76 $ 67 $ 74 $ 78 $ 63 $ 55 $ 65 $ 72
EMEA/APACÏÏÏÏÏÏÏÏÏÏÏÏÏÏÏÏÏÏÏÏÏÏÏ 11 9 21 21 1 (1) 19 17
Latin America ÏÏÏÏÏÏÏÏÏÏÏÏÏÏÏÏÏÏÏÏÏÏÏ 77876676
Unallocated ÏÏÏÏÏÏÏÏÏÏÏÏÏÏÏÏÏÏÏÏÏÏÏÏÏ (80) (69) (33) (34) (46) (43) (37) (39)
Total Operating Income ÏÏÏÏÏÏÏÏÏÏÏÏÏ $ 14 $ 14 $ 70 $ 72 $ 24 $ 17 $ 54 $ 56
Company Restaurant Revenues:
United States and Canada ÏÏÏÏÏÏÏÏÏÏÏÏÏ $ 271 $ 254 $ 254 $ 253 $ 245 $ 220 $ 229 $ 229
EMEA/APACÏÏÏÏÏÏÏÏÏÏÏÏÏÏÏÏÏÏÏÏÏÏÏ 109 100 110 109 106 107 113 109
Latin America ÏÏÏÏÏÏÏÏÏÏÏÏÏÏÏÏÏÏÏÏÏÏÏ 14 14 15 13 13 12 12 12
Total Company Restaurant Revenues ÏÏ $ 394 $ 368 $ 379 $ 375 $ 364 $ 339 $ 354 $ 350
Company Restaurant Margin:
United States and Canada ÏÏÏÏÏÏÏÏÏÏÏÏÏ 15.1% 12.2% 14.2% 14.2% 15.1% 11.4% 17.0% 13.1%
EMEA/APACÏÏÏÏÏÏÏÏÏÏÏÏÏÏÏÏÏÏÏÏÏÏÏ 12.8% 12.0% 15.5% 15.6% 13.2% 13.1% 17.7% 16.5%
Latin America ÏÏÏÏÏÏÏÏÏÏÏÏÏÏÏÏÏÏÏÏÏÏÏ 28.6% 28.6% 33.3% 23.1% 30.8% 33.3% 25.0% 33.3%
Company Restaurant Margin ÏÏÏÏÏÏÏÏÏÏÏ 15.0% 12.8% 15.3% 14.9% 15.1% 12.7% 17.5% 14.9%
Franchise Revenues:
United States and Canada ÏÏÏÏÏÏÏÏÏÏÏÏÏ $ 70 $ 65 $ 66 $ 67 $ 70 $ 66 $ 67 $ 67
EMEA/APACÏÏÏÏÏÏÏÏÏÏÏÏÏÏÏÏÏÏÏÏÏÏÏ 32 27 29 30 29 27 29 28
Latin America ÏÏÏÏÏÏÏÏÏÏÏÏÏÏÏÏÏÏÏÏÏÏÏ 98988787
Total Franchise RevenuesÏÏÏÏÏÏÏÏÏÏÏÏ $ 111 $ 100 $ 104 $ 105 $ 107 $ 100 $ 104 $ 102
52