Burger King 2006 Annual Report Download - page 55
Download and view the complete annual report
Please find page 55 of the 2006 Burger King annual report below. You can navigate through the pages in the report by either clicking on the pages listed below, or by using the keyword search tool below to find specific information within the annual report.-
 1
1 -
2
-
3
-
4
-
5
-
6
-
7
-
8
-
9
-
10
-
11
-
12
-
13
-
14
-
15
-
16
-
17
-
18
-
19
-
20
-
21
-
22
-
23
-
24
-
25
-
26
-
27
-
28
-
29
-
30
-
31
-
32
-
33
-
34
-
35
-
36
-
37
-
38
-
39
-
40
-
41
-
42
-
43
-
44
-
 45
45 -
 46
46 -
 47
47 -
 48
48 -
 49
49 -
 50
50 -
 51
51 -
 52
52 -
 53
53 -
 54
54 -
 55
55 -
 56
56 -
 57
57 -
 58
58 -
 59
59 -
 60
60 -
 61
61 -
 62
62 -
 63
63 -
 64
64 -
 65
65 -
66
-
67
-
68
-
69
-
70
-
71
-
72
-
73
-
74
-
75
-
76
-
77
-
78
-
79
-
80
-
81
-
82
-
83
-
84
-
85
-
86
-
87
-
88
-
89
-
90
-
91
-
92
-
93
-
94
-
95
-
96
-
97
-
98
-
99
-
100
-
101
-
102
-
103
-
104
-
105
-
106
-
107
-
108
-
109
-
110
-
111
-
112
-
113
-
114
-
115
-
116
-
117
-
118
-
119
-
120
-
121
-
122
-
123
-
124
-
125
-
126
-
127
-
128
-
129
-
130
-
131
 |
 |

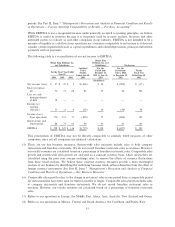
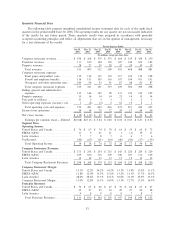
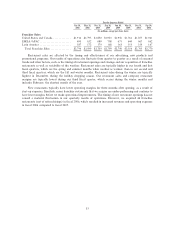
significantly reduced the number of franchise restaurants in distress from over 2,540 in August 2003 to
approximately 60 at June 30, 2006.
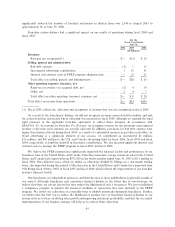
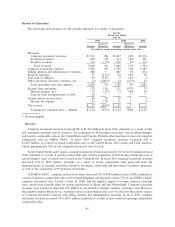
Franchise system distress had a significant impact on our results of operations during fiscal 2004 and
fiscal 2005:
For the
Fiscal Year Ended
June 30,
2006 2005 2004
(In millions)
Revenues:
Revenue not recognized(1) ÏÏÏÏÏÏÏÏÏÏÏÏÏÏÏÏÏÏÏÏÏÏÏÏÏÏÏÏÏÏÏÏÏÏÏÏÏ $Ì $(3) $ 22
Selling, general and administrative:
Bad debt expense ÏÏÏÏÏÏÏÏÏÏÏÏÏÏÏÏÏÏÏÏÏÏÏÏÏÏÏÏÏÏÏÏÏÏÏÏÏÏÏÏÏÏÏÏÏ (1) 1 11
Incremental advertising contributions ÏÏÏÏÏÏÏÏÏÏÏÏÏÏÏÏÏÏÏÏÏÏÏÏÏÏÏÏÏ 1 15 41
Internal and external costs of FFRP program administration ÏÏÏÏÏÏÏÏÏ Ì 12 11
Total effect on selling, general and administrative ÏÏÏÏÏÏÏÏÏÏÏÏÏÏÏÏÏÏ $Ì $28 $ 63
Other operating expenses (income), net:
Reserves (recoveries) on acquired debt, net ÏÏÏÏÏÏÏÏÏÏÏÏÏÏÏÏÏÏÏÏÏÏÏ (2) 4 19
Other, netÏÏÏÏÏÏÏÏÏÏÏÏÏÏÏÏÏÏÏÏÏÏÏÏÏÏÏÏÏÏÏÏÏÏÏÏÏÏÏÏÏÏÏÏÏÏÏÏÏÏÏÏ 2 4 1
Total effect on other operating (income) expenses, net ÏÏÏÏÏÏÏÏÏÏÏÏÏÏ $Ì $ 8 $ 20
Total effect on income from operations ÏÏÏÏÏÏÏÏÏÏÏÏÏÏÏÏÏÏÏÏÏÏÏÏÏÏÏÏÏ $Ì $33 $105
(1) Fiscal 2005 reflects the collection and recognition of revenue that was not recognized in fiscal 2004.
As a result of the franchisees' distress, we did not recognize revenues associated with royalties and rent
for certain franchise restaurants where collection was uncertain in fiscal 2004, although we retained the legal
right pursuant to the applicable franchise agreement to collect these amounts. In accordance with
SFAS No. 45, Accounting for Franchise Fee Revenue, we recognize revenue for the previously unrecognized
revenue at the time such amounts are actually collected. In addition, provisions for bad debt expense were
higher than historical levels during fiscal 2004, as a result of a substantial increase in past due receivables. As
brand advertising is a significant element of our success, we contributed an incremental $1 million,
$15 million, and $41 million to the U.S. and Canada advertising fund for fiscal 2006, fiscal 2005 and fiscal
2004, respectively, to fund the shortfall in franchisee contributions. We also incurred significant internal and
external costs to manage the FFRP program in fiscal 2005 and fiscal 2004.
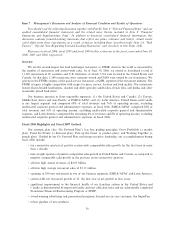
We believe the FFRP program has significantly improved the financial health and performance of our
franchisee base in the United States and Canada. Franchise restaurant average restaurant sales in the United
States and Canada have improved from $973,000 in the twelve months ended June 30, 2003 to $1.1 million in
fiscal 2006. Our collection rates, which we define as collections divided by billings on a one-month trailing
basis, also improved during this period. Collection rates in the United States and Canada have improved from
91% during fiscal 2004 to 100% in fiscal 2005 and fiscal 2006, which reflects the improvement of our franchise
system's financial health.
Our franchisees are independent operators, and their decision to incur indebtedness is generally outside of
our control. Although franchisees may experience financial distress in the future due to over-leverage, we
believe that there are certain factors that may reduce the likelihood of such a recurrence. We have established
a compliance program to monitor the financial condition of restaurants that were formerly in the FFRP
program. We review our collections on a monthly basis to identify potentially distressed franchisees. Further,
we believe that the best way to reduce the likelihood of another wave of franchisee financial distress in our
system is for us to focus on driving sales growth and improving restaurant profitability, and that the successful
implementation of our business strategy will help us to achieve these objectives.
43