Burger King 2006 Annual Report Download - page 59
Download and view the complete annual report
Please find page 59 of the 2006 Burger King annual report below. You can navigate through the pages in the report by either clicking on the pages listed below, or by using the keyword search tool below to find specific information within the annual report.-
 1
1 -
2
-
3
-
4
-
5
-
6
-
7
-
8
-
9
-
10
-
11
-
12
-
13
-
14
-
15
-
16
-
17
-
18
-
19
-
20
-
21
-
22
-
23
-
24
-
25
-
26
-
27
-
28
-
29
-
30
-
31
-
32
-
33
-
34
-
35
-
36
-
37
-
38
-
39
-
40
-
41
-
42
-
43
-
44
-
45
-
46
-
47
-
48
-
 49
49 -
 50
50 -
 51
51 -
 52
52 -
 53
53 -
 54
54 -
 55
55 -
 56
56 -
 57
57 -
 58
58 -
 59
59 -
 60
60 -
 61
61 -
 62
62 -
 63
63 -
 64
64 -
 65
65 -
 66
66 -
 67
67 -
 68
68 -
 69
69 -
70
-
71
-
72
-
73
-
74
-
75
-
76
-
77
-
78
-
79
-
80
-
81
-
82
-
83
-
84
-
85
-
86
-
87
-
88
-
89
-
90
-
91
-
92
-
93
-
94
-
95
-
96
-
97
-
98
-
99
-
100
-
101
-
102
-
103
-
104
-
105
-
106
-
107
-
108
-
109
-
110
-
111
-
112
-
113
-
114
-
115
-
116
-
117
-
118
-
119
-
120
-
121
-
122
-
123
-
124
-
125
-
126
-
127
-
128
-
129
-
130
-
131
 |
 |
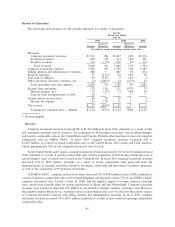
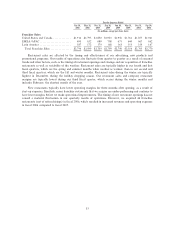
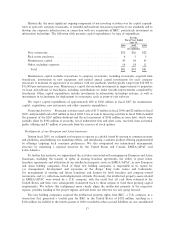
product costs decreased 0.1% to 31.0%, primarily due to reduced beef and cheese prices in the United States,
partially offset by increased beef prices in Europe. In fiscal 2005, food, paper and product costs increased 12%
to $437 million, primarily as a result of a 10% increase in company restaurant revenues. As a percentage of
company restaurant revenues, food, paper and product costs increased 0.5% to 31.1% in fiscal 2005, primarily
as a result of increases in the price of beef in the United States.
In the United States and Canada, food, paper and product costs increased 9% to $325 million in fiscal
2006, primarily as a result of a 12% increase in company restaurant revenues. Food, paper and product costs
decreased 0.6% to 31.5% of company restaurant revenues, primarily due to reduced beef and cheese prices. In
fiscal 2005, food, paper and product costs increased 16% to $297 million, primarily as a result of a 15%
increase in company restaurant revenues. As a percentage of company restaurant revenues, food, paper and
product costs increased 0.3% to 32.1% in fiscal 2005, primarily as a result of increases in the price of beef.
In EMEA/APAC, food, paper and product costs increased 2% to $125 million in fiscal 2006, primarily as
a result of increased beef prices in Europe, partially offset by a 2% decrease in company restaurant revenues
and favorable foreign currency exchange rates. Food, paper and product costs increased 1.2% to 29.2% of
company restaurant revenues, primarily as a result of the increased beef prices in Europe. In fiscal 2005, food,
paper and product costs increased 2% to $122 million in EMEA/APAC, primarily as a result of a 1% increase
in company restaurant revenues.
In Latin America, food, paper and product costs increased 11% in fiscal 2006, primarily as a result of a
14% increase in company restaurant revenues. In fiscal 2005, food, paper and product costs increased 7% to
$18 million, primarily as a result of an 8% increase in company restaurant revenues.
Payroll and employee benefits costs increased 7% to $446 million in fiscal 2006. Payroll and employee
benefits costs decreased 0.1% to 29.4% of company restaurant revenues in fiscal 2006 compared to 29.5% in
fiscal 2005. Payroll and employee benefits costs have continued to increase as a result of increases in wages
and other costs of labor, particularly health insurance, as well as an increase in the number of company
restaurants. Partially offsetting these increased costs was a reduction in the labor required to operate our
restaurants, due to our operational excellence programs and operational efficiency programs implemented in
Europe.
In fiscal 2005, payroll and employee benefits costs increased 9% to $415 million, as a result of increased
wages, health insurance and training expenses, as well as the acquisition of franchise restaurants in fiscal 2005.
Payroll and employee benefits costs decreased 0.4% to 29.5% of company restaurant revenues in fiscal 2005 as
higher costs of wages and health insurance benefits were more than offset by increasing restaurant sales and
efficiency gains from our operational excellence programs to reduce the labor required to operate our
restaurants.
In the United States and Canada, payroll and employee benefits costs increased 13% to $312 million in
fiscal 2006, primarily as a result of the acquisition of 40 franchise restaurants (net of refranchisings) and
increased wages and health insurance benefit costs. Payroll and employee benefits costs increased 0.3% to
30.2% of company restaurant revenues. In fiscal 2005, payroll and employee benefits costs increased 12% to
$276 million, primarily as a result of the acquisition of franchise restaurants and increased wages and health
insurance benefit costs. Payroll and employee benefits costs were 29.9% of company restaurant revenues,
compared to 30.8% in fiscal 2004, primarily as a result of leveraging payroll costs from increased sales and
efficiency gains resulting from our operational improvement initiatives.
In EMEA/APAC, payroll and employee benefits costs decreased 5% to $127 million in fiscal 2006,
primarily as a result of favorable foreign currency exchange rates. Payroll and employee benefits costs
decreased 1.1% to 29.7% of company restaurant revenues in EMEA/APAC. In fiscal 2005, payroll and
employee benefits costs increased 3% to $134 million, primarily as a result of new company restaurants in
Germany and increased wages and benefits costs. Payroll and employee benefits costs were 30.8% of company
restaurant revenues in EMEA/APAC, compared to 30.3% in fiscal 2004.
In Latin America, where labor costs are lower than in the United States and Canada and EMEA/APAC
segments, payroll and employee benefits costs increased 17% to $7 million in fiscal 2006, primarily as a result
47