Burger King 2006 Annual Report Download - page 60
Download and view the complete annual report
Please find page 60 of the 2006 Burger King annual report below. You can navigate through the pages in the report by either clicking on the pages listed below, or by using the keyword search tool below to find specific information within the annual report.-
 1
1 -
2
-
3
-
4
-
5
-
6
-
7
-
8
-
9
-
10
-
11
-
12
-
13
-
14
-
15
-
16
-
17
-
18
-
19
-
20
-
21
-
22
-
23
-
24
-
25
-
26
-
27
-
28
-
29
-
30
-
31
-
32
-
33
-
34
-
35
-
36
-
37
-
38
-
39
-
40
-
41
-
42
-
43
-
44
-
45
-
46
-
47
-
48
-
49
-
 50
50 -
 51
51 -
 52
52 -
 53
53 -
 54
54 -
 55
55 -
 56
56 -
 57
57 -
 58
58 -
 59
59 -
 60
60 -
 61
61 -
 62
62 -
 63
63 -
 64
64 -
 65
65 -
 66
66 -
 67
67 -
 68
68 -
 69
69 -
 70
70 -
71
-
72
-
73
-
74
-
75
-
76
-
77
-
78
-
79
-
80
-
81
-
82
-
83
-
84
-
85
-
86
-
87
-
88
-
89
-
90
-
91
-
92
-
93
-
94
-
95
-
96
-
97
-
98
-
99
-
100
-
101
-
102
-
103
-
104
-
105
-
106
-
107
-
108
-
109
-
110
-
111
-
112
-
113
-
114
-
115
-
116
-
117
-
118
-
119
-
120
-
121
-
122
-
123
-
124
-
125
-
126
-
127
-
128
-
129
-
130
-
131
 |
 |
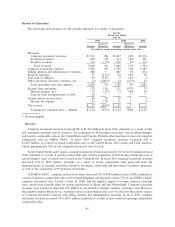
of nine new company restaurant openings since June 30, 2005. Payroll and employee benefits costs increased
0.9% to 12.5% of company restaurant revenues in Latin America. In fiscal 2005, payroll and employee benefits
costs increased 12% to $6 million, primarily as a result of new company restaurants. Payroll and employee
benefits costs were 11.4% of company restaurant revenues in Latin America in fiscal 2005, compared to 11.0%
in fiscal 2004.
Occupancy and other operating costs increased 11% to $380 million in fiscal 2006. Occupancy and other
operating costs were 25.1% of company restaurant revenues in fiscal 2006 compared to 24.4% in fiscal 2005.
These increases are primarily attributable to the acquisition of franchise restaurants and increased utility costs.
Occupancy and other operating costs increased 9% to $343 million in fiscal 2005, primarily as a result of
the acquisition of franchise restaurants and increases in costs such as rents and utilities. Occupancy and other
operating costs were 24.4% of company restaurant revenues in fiscal 2005 compared to 24.6% in fiscal 2004,
primarily because of sales growth.
In the United States and Canada, occupancy and other operating costs increased to 24.1% of company
restaurant revenues in fiscal 2006 compared to 23.6% in fiscal 2005, primarily as a result of increased utility
and restaurant supply costs. In fiscal 2005, occupancy and other operating costs were 23.6% of company
restaurant revenues compared to 26.1% in fiscal 2004, primarily as a result of leveraging base rents from
increased sales.
In EMEA/APAC, occupancy and other operating costs increased to 27.3% of company restaurant
revenues in fiscal 2006 compared to 26.1% in fiscal 2005, as a result of decreased restaurant sales, increased
utilities in the segment and increased rents in the United Kingdom, partially offset by the closure of certain
restaurants with higher than average restaurant rents. In fiscal 2005, occupancy and other operating costs were
26.1% of company restaurant revenues compared to 22.9% in fiscal 2004, primarily as a result of increased
rents and utilities in the United Kingdom and adjustments we recorded in fiscal 2004 when we finalized our
purchase accounting allocations.
In Latin America, occupancy and other operating costs increased to 25% of company restaurant revenues
in fiscal 2006 from 21.6% in fiscal 2005, primarily as a result of a decrease in comparable sales and increased
utility costs. In fiscal 2005, occupancy and other operating costs were 21.6% of company restaurant revenues
compared to 13.7% in fiscal 2004, primarily as a result of increased utility costs and adjustments we recorded
in fiscal 2004 when we finalized our purchase accounting allocations.
Worldwide selling, general and administrative expenses
Selling, general and administrative expenses increased by $1 million to $488 million during fiscal 2006.
General and administrative expenses increased $17 million to $416 million, while selling expenses decreased
$16 million to $72 million.
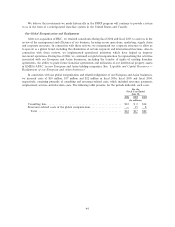
Our fiscal 2006 general and administrative expenses included $34 million of compensation expense and
taxes related to the compensatory make-whole payment, $10 million in expenses associated with the
realignment of our European and Asian businesses and $5 million of executive severance expense. Addition-
ally, our acquisition of 44 franchise restaurants (net of refranchisings) resulted in increased general and
administrative expenses related to the management of our company restaurants. Partially offsetting these
increased expenses was a $19 million reduction in general and administrative expenses related to franchise
system distress and our global reorganization costs in fiscal 2006.
The $16 million decrease in selling expenses in fiscal 2006 is primarily attributable to a $14 million
decrease in incremental advertising expense compared to fiscal 2005 resulting from franchisee non-payment of
advertising contributions. Partially offsetting this reduction were incremental advertising expenses for
company restaurants opened or acquired in fiscal 2006.
In fiscal 2005, selling, general and administrative expenses increased $13 million to $487 million. General
and administrative costs increased 10% to $399 million, while selling expenses decreased 21% to $88 million.
48