Burger King 2006 Annual Report Download - page 108
Download and view the complete annual report
Please find page 108 of the 2006 Burger King annual report below. You can navigate through the pages in the report by either clicking on the pages listed below, or by using the keyword search tool below to find specific information within the annual report.-
 1
1 -
2
-
3
-
4
-
5
-
6
-
7
-
8
-
9
-
10
-
11
-
12
-
13
-
14
-
15
-
16
-
17
-
18
-
19
-
20
-
21
-
22
-
23
-
24
-
25
-
26
-
27
-
28
-
29
-
30
-
31
-
32
-
33
-
34
-
35
-
36
-
37
-
38
-
39
-
40
-
41
-
42
-
43
-
44
-
45
-
46
-
47
-
48
-
49
-
50
-
51
-
52
-
53
-
54
-
55
-
56
-
57
-
58
-
59
-
60
-
61
-
62
-
63
-
64
-
65
-
66
-
67
-
68
-
69
-
70
-
71
-
72
-
73
-
74
-
75
-
76
-
77
-
78
-
79
-
80
-
81
-
82
-
83
-
84
-
85
-
86
-
87
-
88
-
89
-
90
-
91
-
92
-
93
-
94
-
95
-
96
-
97
-
 98
98 -
 99
99 -
 100
100 -
 101
101 -
 102
102 -
 103
103 -
 104
104 -
 105
105 -
 106
106 -
 107
107 -
 108
108 -
 109
109 -
 110
110 -
 111
111 -
 112
112 -
 113
113 -
 114
114 -
 115
115 -
 116
116 -
 117
117 -
 118
118 -
119
-
120
-
121
-
122
-
123
-
124
-
125
-
126
-
127
-
128
-
129
-
130
-
131
 |
 |

BURGER KING HOLDINGS, INC. AND SUBSIDIARIES
Notes to Consolidated Financial Statements Ì (Continued)
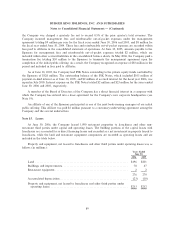
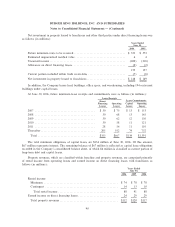
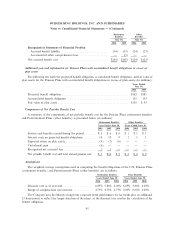
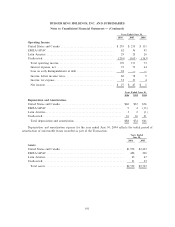
The weighted-average assumptions used in computing the net periodic benefit cost of the U.S. Pension
Plans (retirement benefits) and Postretirement Plans (other benefits) are as follows:
Retirement Benefits Other Benefits
Years Ended June 30, Years Ended June 30,
2006 2005 2004 2006 2005 2004
Discount rate ÏÏÏÏÏÏÏÏÏÏÏÏÏÏÏÏÏÏÏÏÏÏÏÏÏÏÏÏÏÏÏÏÏ 5.86% 6.00% 6.25% 5.86% 6.00% 6.25%
Range of compensation rate increaseÏÏÏÏÏÏÏÏÏÏÏÏÏÏ 4.75% 4.75% 4.75% 0.00% 0.00% 0.00%
Expected long-term rate of return on plan assetsÏÏÏÏ 8.75% 8.75% 8.75% 0.00% 0.00% 0.00%
The expected long-term rate of return on plan assets is determined by expected future returns on the asset
categories in target investment allocation. These expected returns are based on historical returns for each
asset's category adjusted for an assessment of current market conditions.
The assumed healthcare cost trend rates are as follows:
Years Ended June 30,
2006 2005 2004
Healthcare cost trend rate assumed for next year ÏÏÏÏÏÏÏÏÏÏÏÏÏÏÏÏÏÏÏÏÏ 10.00% 9.00% 9.50%
Rate to which the cost trend rate is assumed to decline (the ultimate
trend rate) ÏÏÏÏÏÏÏÏÏÏÏÏÏÏÏÏÏÏÏÏÏÏÏÏÏÏÏÏÏÏÏÏÏÏÏÏÏÏÏÏÏÏÏÏÏÏÏÏÏÏÏ 5.00% 5.00% 5.00%
Year that the rate reaches the ultimate trend rateÏÏÏÏÏÏÏÏÏÏÏÏÏÏÏÏÏÏÏÏÏ 2016 2013 2013
Assumed healthcare cost trend rates do not have a significant effect on the amounts reported for the
postretirement healthcare plans, since a one-percentage point change in the assumed healthcare cost trend
rate would have very minimal effects on service and interest cost and the postretirement obligation.
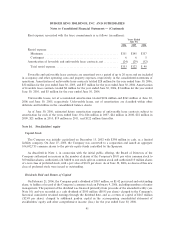
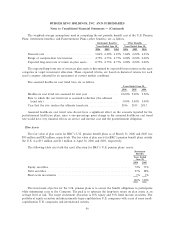
Plan Assets
The fair value of plan assets for BKC's U.S. pension benefit plans as of March 31, 2006 and 2005 was
$95 million and $82 million, respectively. The fair value of plan assets for BKC's pension benefit plans outside
the U.S. was $15 million and $11 million at April 30, 2006 and 2005, respectively.
The following table sets forth the asset allocation for BKC's U.S. pension plans' assets:
Retirement
Benefits
Years Ended
June 30,
2006 2005
Equity securities ÏÏÏÏÏÏÏÏÏÏÏÏÏÏÏÏÏÏÏÏÏÏÏÏÏÏÏÏÏÏÏÏÏÏÏÏÏÏÏÏÏÏÏÏÏÏÏÏÏÏÏÏÏÏÏÏÏ 72% 71%
Debt securitiesÏÏÏÏÏÏÏÏÏÏÏÏÏÏÏÏÏÏÏÏÏÏÏÏÏÏÏÏÏÏÏÏÏÏÏÏÏÏÏÏÏÏÏÏÏÏÏÏÏÏÏÏÏÏÏÏÏÏÏ 27% 28%
Short-term investments ÏÏÏÏÏÏÏÏÏÏÏÏÏÏÏÏÏÏÏÏÏÏÏÏÏÏÏÏÏÏÏÏÏÏÏÏÏÏÏÏÏÏÏÏÏÏÏÏÏÏÏ 1% 1%
100% 100%
The investment objective for the U.S. pension plans is to secure the benefit obligations to participants
while minimizing costs to the Company. The goal is to optimize the long-term return on plan assets at an
average level of risk. The target investment allocation is 65% equity and 35% fixed income securities. The
portfolio of equity securities includes primarily large-capitalization U.S. companies with a mix of some small-
capitalization U.S. companies and international entities.
96