Burger King 2006 Annual Report Download - page 106
Download and view the complete annual report
Please find page 106 of the 2006 Burger King annual report below. You can navigate through the pages in the report by either clicking on the pages listed below, or by using the keyword search tool below to find specific information within the annual report.-
 1
1 -
2
-
3
-
4
-
5
-
6
-
7
-
8
-
9
-
10
-
11
-
12
-
13
-
14
-
15
-
16
-
17
-
18
-
19
-
20
-
21
-
22
-
23
-
24
-
25
-
26
-
27
-
28
-
29
-
30
-
31
-
32
-
33
-
34
-
35
-
36
-
37
-
38
-
39
-
40
-
41
-
42
-
43
-
44
-
45
-
46
-
47
-
48
-
49
-
50
-
51
-
52
-
53
-
54
-
55
-
56
-
57
-
58
-
59
-
60
-
61
-
62
-
63
-
64
-
65
-
66
-
67
-
68
-
69
-
70
-
71
-
72
-
73
-
74
-
75
-
76
-
77
-
78
-
79
-
80
-
81
-
82
-
83
-
84
-
85
-
86
-
87
-
88
-
89
-
90
-
91
-
92
-
93
-
94
-
95
-
 96
96 -
 97
97 -
 98
98 -
 99
99 -
 100
100 -
 101
101 -
 102
102 -
 103
103 -
 104
104 -
 105
105 -
 106
106 -
 107
107 -
 108
108 -
 109
109 -
 110
110 -
 111
111 -
 112
112 -
 113
113 -
 114
114 -
 115
115 -
 116
116 -
117
-
118
-
119
-
120
-
121
-
122
-
123
-
124
-
125
-
126
-
127
-
128
-
129
-
130
-
131
 |
 |

BURGER KING HOLDINGS, INC. AND SUBSIDIARIES
Notes to Consolidated Financial Statements Ì (Continued)
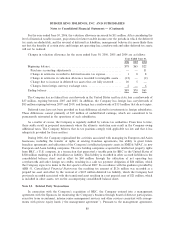
100% of incentive pay on a before-tax basis under the ERP. BKC provides dollar-for-dollar match on up to the
first 6% of base pay. Additionally, the Company may make a discretionary contribution ranging from 0% to 6%
based on Company's performance.
In conjunction with the curtailment gain, the Company approved a distribution totaling $6 million on
behalf of those participants who were affected by the curtailment of the Plans. The distribution was recorded
as a component of selling, general and administrative expenses in the accompanying consolidated statements
of operations for the fiscal year ended June 30, 2006 and was paid by the Company to employees in cash or
contributed to the 401(k) plan in which the employee participates.
Expenses incurred for the savings plan and ERP totaled $6 million for the year ended June 30, 2006,
$5 million for the year ended June 30, 2005, and $5 million for the year ended June 30, 2004.
BKC uses a measurement date of March 31 and April 30 for all of its US and Non-US Plans.
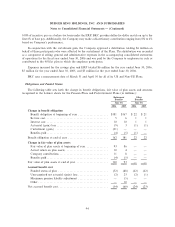
Obligations and Funded Status
The following table sets forth the change in benefit obligations, fair value of plan assets and amounts
recognized in the balance sheets for the Pension Plans and Postretirement Plans (in millions):
Retirement Other
Benefits Benefits
June 30, June 30,
2006 2005 2006 2005
Change in benefit obligation
Benefit obligation at beginning of year ÏÏÏÏÏÏÏÏÏÏÏÏÏÏÏÏÏÏÏÏÏ $181 $167 $ 22 $ 21
Service costÏÏÏÏÏÏÏÏÏÏÏÏÏÏÏÏÏÏÏÏÏÏÏÏÏÏÏÏÏÏÏÏÏÏÏÏÏÏÏÏÏÏÏÏ 5611
Interest cost ÏÏÏÏÏÏÏÏÏÏÏÏÏÏÏÏÏÏÏÏÏÏÏÏÏÏÏÏÏÏÏÏÏÏÏÏÏÏÏÏÏÏÏ 10 10 1 1
Actuarial (gain) loss ÏÏÏÏÏÏÏÏÏÏÏÏÏÏÏÏÏÏÏÏÏÏÏÏÏÏÏÏÏÏÏÏÏÏÏÏ (9) 3 (1) (1)
Curtailment (gain) ÏÏÏÏÏÏÏÏÏÏÏÏÏÏÏÏÏÏÏÏÏÏÏÏÏÏÏÏÏÏÏÏÏÏÏÏÏ (21) Ì Ì Ì
Benefits paidÏÏÏÏÏÏÏÏÏÏÏÏÏÏÏÏÏÏÏÏÏÏÏÏÏÏÏÏÏÏÏÏÏÏÏÏÏÏÏÏÏÏÏ (4) (5) (1) Ì
Benefit obligation at end of year ÏÏÏÏÏÏÏÏÏÏÏÏÏÏÏÏÏÏÏÏÏÏÏÏÏÏÏÏ 162 181 22 22
Change in fair value of plan assets
Fair value of plan assets at beginning of yearÏÏÏÏÏÏÏÏÏÏÏÏÏÏÏÏ 93 86 Ì Ì
Actual return on plan assets ÏÏÏÏÏÏÏÏÏÏÏÏÏÏÏÏÏÏÏÏÏÏÏÏÏÏÏÏÏÏ 10 4 Ì Ì
Company contributions ÏÏÏÏÏÏÏÏÏÏÏÏÏÏÏÏÏÏÏÏÏÏÏÏÏÏÏÏÏÏÏÏÏÏ 11 8 Ì Ì
Benefits paidÏÏÏÏÏÏÏÏÏÏÏÏÏÏÏÏÏÏÏÏÏÏÏÏÏÏÏÏÏÏÏÏÏÏÏÏÏÏÏÏÏÏÏ (4) (5) Ì Ì
Fair value of plan assets at end of yearÏÏÏÏÏÏÏÏÏÏÏÏÏÏÏÏÏÏÏÏÏÏÏ 110 93 Ì Ì
Accrued benefit cost
Funded status of plan ÏÏÏÏÏÏÏÏÏÏÏÏÏÏÏÏÏÏÏÏÏÏÏÏÏÏÏÏÏÏÏÏÏÏÏ (52) (88) (22) (22)
Unrecognized net actuarial (gain) loss ÏÏÏÏÏÏÏÏÏÏÏÏÏÏÏÏÏÏÏÏÏ (2) 23 (2) (1)
Minimum pension liability adjustment ÏÏÏÏÏÏÏÏÏÏÏÏÏÏÏÏÏÏÏÏÏ Ì (5) Ì Ì
Other ÏÏÏÏÏÏÏÏÏÏÏÏÏÏÏÏÏÏÏÏÏÏÏÏÏÏÏÏÏÏÏÏÏÏÏÏÏÏÏÏÏÏÏÏÏÏÏÏÏ Ì 10 Ì Ì
Net accrued benefit cost ÏÏÏÏÏÏÏÏÏÏÏÏÏÏÏÏÏÏÏÏÏÏÏÏÏÏÏÏÏÏÏÏÏÏÏ (54) (60) (24) (23)
94