Burger King 2006 Annual Report Download - page 52
Download and view the complete annual report
Please find page 52 of the 2006 Burger King annual report below. You can navigate through the pages in the report by either clicking on the pages listed below, or by using the keyword search tool below to find specific information within the annual report.-
 1
1 -
2
-
3
-
4
-
5
-
6
-
7
-
8
-
9
-
10
-
11
-
12
-
13
-
14
-
15
-
16
-
17
-
18
-
19
-
20
-
21
-
22
-
23
-
24
-
25
-
26
-
27
-
28
-
29
-
30
-
31
-
32
-
33
-
34
-
35
-
36
-
37
-
38
-
39
-
40
-
41
-
 42
42 -
 43
43 -
 44
44 -
 45
45 -
 46
46 -
 47
47 -
 48
48 -
 49
49 -
 50
50 -
 51
51 -
 52
52 -
 53
53 -
 54
54 -
 55
55 -
 56
56 -
 57
57 -
 58
58 -
 59
59 -
 60
60 -
 61
61 -
 62
62 -
63
-
64
-
65
-
66
-
67
-
68
-
69
-
70
-
71
-
72
-
73
-
74
-
75
-
76
-
77
-
78
-
79
-
80
-
81
-
82
-
83
-
84
-
85
-
86
-
87
-
88
-
89
-
90
-
91
-
92
-
93
-
94
-
95
-
96
-
97
-
98
-
99
-
100
-
101
-
102
-
103
-
104
-
105
-
106
-
107
-
108
-
109
-
110
-
111
-
112
-
113
-
114
-
115
-
116
-
117
-
118
-
119
-
120
-
121
-
122
-
123
-
124
-
125
-
126
-
127
-
128
-
129
-
130
-
131
 |
 |

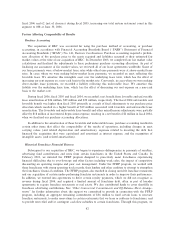
business by identifying the underlying business trend, without distortion from the effect of foreign currency
movements.
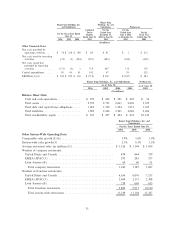
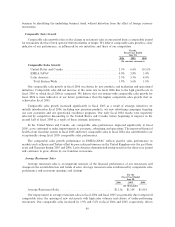
Comparable Sales Growth
Comparable sales growth refers to the change in restaurant sales in one period from a comparable period
for restaurants that have been open for thirteen months or longer. We believe comparable sales growth is a key
indicator of our performance, as influenced by our initiatives and those of our competitors.
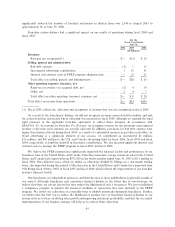
For the
Fiscal Year Ended
June 30,
2006 2005 2004
(In constant currencies)
Comparable Sales Growth:
United States and Canada ÏÏÏÏÏÏÏÏÏÏÏÏÏÏÏÏÏÏÏÏÏÏÏÏÏÏÏÏÏÏÏÏÏÏÏÏÏ 2.5% 6.6% (0.5)%
EMEA/APAC ÏÏÏÏÏÏÏÏÏÏÏÏÏÏÏÏÏÏÏÏÏÏÏÏÏÏÏÏÏÏÏÏÏÏÏÏÏÏÏÏÏÏÏÏÏÏ 0.0% 2.8% 5.4%
Latin America ÏÏÏÏÏÏÏÏÏÏÏÏÏÏÏÏÏÏÏÏÏÏÏÏÏÏÏÏÏÏÏÏÏÏÏÏÏÏÏÏÏÏÏÏÏÏÏ 2.5% 5.5% 4.0%
Total System-WideÏÏÏÏÏÏÏÏÏÏÏÏÏÏÏÏÏÏÏÏÏÏÏÏÏÏÏÏÏÏÏÏÏÏÏÏÏÏÏÏÏ 1.9% 5.6% 1.0%
Our comparable sales growth in fiscal 2006 was driven by new products and marketing and operational
initiatives. Comparable sales did not increase at the same rate in fiscal 2006 due to the high growth rate in
fiscal 2005 to which fiscal 2006 is compared. We believe that our system-wide comparable sales growth for
fiscal 2006 is more indicative of our future performance than the higher comparable sales growth that we
achieved in fiscal 2005.
Comparable sales growth increased significantly in fiscal 2005 as a result of strategic initiatives we
initially introduced in fiscal 2004, including new premium products, our new advertising campaigns targeting
our core customers and our operational excellence programs. Our early fiscal 2004 results were negatively
affected by competitive discounting in the United States and Canada, before beginning to improve in the
second half of fiscal 2004 as a result of these strategic initiatives.
In the United States and Canada, our comparable sales performance improved significantly in fiscal
2005, as we continued to make improvements to our menu, advertising and operations. The improved financial
health of our franchise system in fiscal 2005 and lower comparable sales in fiscal 2004 also contributed to our
exceptionally strong fiscal 2005 comparable sales performance.
The comparable sales growth performance in EMEA/APAC reflects positive sales performance in
markets such as Spain and Turkey offset by poor sales performance in the United Kingdom over the past three
years and Germany during 2005 and 2006. Latin America demonstrated strong results in the three-year period
and continues to grow, driven by our franchise restaurants.
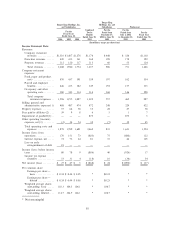
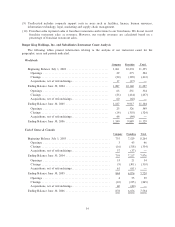
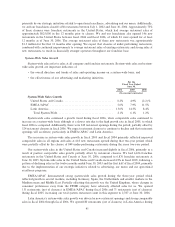
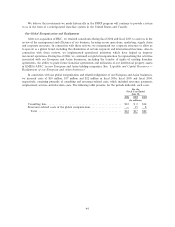
Average Restaurant Sales
Average restaurant sales is an important measure of the financial performance of our restaurants and
changes in the overall direction and trends of sales. Average restaurant sales is influenced by comparable sales
performance and restaurant openings and closings.
For the
Fiscal Year Ended
June 30,
2006 2005 2004
(In thousands)
Average Restaurant Sales ÏÏÏÏÏÏÏÏÏÏÏÏÏÏÏÏÏÏÏÏÏÏÏÏÏÏÏÏÏÏÏÏÏÏÏÏ $1,126 $1,104 $1,014
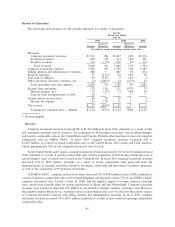
Our improvement in average restaurant sales in fiscal 2006 and fiscal 2005 was primarily due to improved
comparable sales, the opening of new restaurants with high sales volumes and closure of under-performing
restaurants. Our comparable sales increased by 1.9% and 5.6% in fiscal 2006 and 2005, respectively, driven
40