Burger King 2006 Annual Report Download - page 61
Download and view the complete annual report
Please find page 61 of the 2006 Burger King annual report below. You can navigate through the pages in the report by either clicking on the pages listed below, or by using the keyword search tool below to find specific information within the annual report.-
 1
1 -
2
-
3
-
4
-
5
-
6
-
7
-
8
-
9
-
10
-
11
-
12
-
13
-
14
-
15
-
16
-
17
-
18
-
19
-
20
-
21
-
22
-
23
-
24
-
25
-
26
-
27
-
28
-
29
-
30
-
31
-
32
-
33
-
34
-
35
-
36
-
37
-
38
-
39
-
40
-
41
-
42
-
43
-
44
-
45
-
46
-
47
-
48
-
49
-
50
-
 51
51 -
 52
52 -
 53
53 -
 54
54 -
 55
55 -
 56
56 -
 57
57 -
 58
58 -
 59
59 -
 60
60 -
 61
61 -
 62
62 -
 63
63 -
 64
64 -
 65
65 -
 66
66 -
 67
67 -
 68
68 -
 69
69 -
 70
70 -
 71
71 -
72
-
73
-
74
-
75
-
76
-
77
-
78
-
79
-
80
-
81
-
82
-
83
-
84
-
85
-
86
-
87
-
88
-
89
-
90
-
91
-
92
-
93
-
94
-
95
-
96
-
97
-
98
-
99
-
100
-
101
-
102
-
103
-
104
-
105
-
106
-
107
-
108
-
109
-
110
-
111
-
112
-
113
-
114
-
115
-
116
-
117
-
118
-
119
-
120
-
121
-
122
-
123
-
124
-
125
-
126
-
127
-
128
-
129
-
130
-
131
 |
 |

General and administrative expenses included $29 million and $33 million of costs associated with the
FFRP program's administration and severance and consulting fees incurred in connection with our global
reorganization in fiscal 2005 and fiscal 2004, respectively. Our fiscal 2005 general and administrative cost
increases also included $14 million of incremental incentive compensation as a result of improved restaurant
operations and our improved financial performance, as well as $7 million of increased costs associated with
operational excellence initiatives. Our remaining general and administrative expense increases in fiscal 2005
were attributable to the acquisition of franchise restaurants and increases in restaurant operations and business
development teams, particularly in EMEA/APAC where our general and administrative expenses increased
by $18 million in fiscal 2005.
The decrease in selling expenses is attributable to a decrease in advertising expense and bad debt expense.
Our bad debt expense decreased to $1 million in fiscal 2005 from $11 million in fiscal 2004 and our
incremental advertising expense resulting from franchisee non-payment of advertising contributions was
$15 million in fiscal 2005 compared to $41 million in fiscal 2004. These improvements resulted from the
strengthening of our franchise system during fiscal 2005. Partially offsetting these reductions were incremental
advertising expenses for company restaurants opened or acquired in fiscal 2005.
Property expenses
Property expenses decreased by $7 million to $57 million in fiscal 2006, as a result of a decrease in the
number of properties that we lease or sublease to franchisees, primarily due to restaurant closures and
acquisition of franchise restaurants. Additionally, the revenues from properties that we lease or sublease to
non-restaurant businesses after restaurant closures is treated as a reduction in property expenses, resulting in
decreased property revenues and expenses in fiscal 2006. Property expenses were 35% of property revenues in
the United States and Canada in fiscal 2006 compared to 36% in fiscal 2005 and 35% in fiscal 2004. Our
property expenses in EMEA/APAC approximate our property revenues because most of the EMEA/APAC
property operations consist of properties that are subleased to franchisees on a pass-through basis.
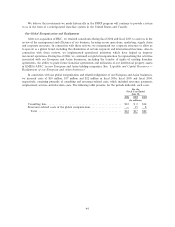
Fees paid to affiliates
Fees paid to affiliates increased to $39 million in fiscal 2006, compared to $9 million and $8 million in
fiscal 2005 and fiscal 2004, respectively, as a result of the $30 million management agreement termination fee
paid to the Sponsors.
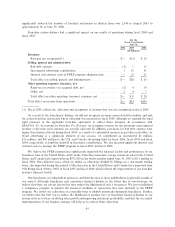
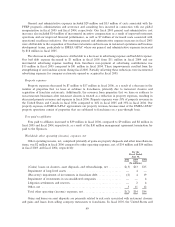
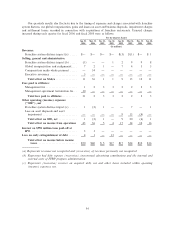
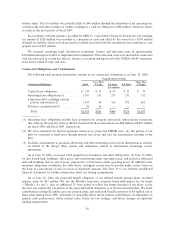
Worldwide other operating (income) expenses, net
Other operating income, net, comprised primarily of gains on property disposals and other miscellaneous
items, was $2 million in fiscal 2006 compared to other operating expenses, net, of $34 million and $54 million
in fiscal 2005 and fiscal 2004, respectively:
For the
Fiscal Ended
June 30,
2006 2005 2004
(In millions)
(Gains) losses on closures, asset disposals, and refranchisings, net ÏÏÏÏÏÏÏÏÏ $(3) $13 $15
Impairment of long-lived assets ÏÏÏÏÏÏÏÏÏÏÏÏÏÏÏÏÏÏÏÏÏÏÏÏÏÏÏÏÏÏÏÏÏÏÏÏÏÏ Ì 4 Ì
(Recovery) impairment of investments in franchisee debt ÏÏÏÏÏÏÏÏÏÏÏÏÏÏÏÏ (2) 4 19
Impairment of investments in unconsolidated companies ÏÏÏÏÏÏÏÏÏÏÏÏÏÏÏÏÏ Ì Ì 4
Litigation settlements and reserves ÏÏÏÏÏÏÏÏÏÏÏÏÏÏÏÏÏÏÏÏÏÏÏÏÏÏÏÏÏÏÏÏÏÏÏÏ Ì 2 4
Other, net ÏÏÏÏÏÏÏÏÏÏÏÏÏÏÏÏÏÏÏÏÏÏÏÏÏÏÏÏÏÏÏÏÏÏÏÏÏÏÏÏÏÏÏÏÏÏÏÏÏÏÏÏÏÏÏÏ 3 11 12
Total other operating (income) expenses, netÏÏÏÏÏÏÏÏÏÏÏÏÏÏÏÏÏÏÏÏÏÏÏÏÏÏÏ $(2) $34 $54
Gains and losses on asset disposals are primarily related to exit costs associated with restaurant closures
and gains and losses from selling company restaurants to franchisees. In fiscal 2005, the United States and
49