Burger King 2006 Annual Report Download - page 48
Download and view the complete annual report
Please find page 48 of the 2006 Burger King annual report below. You can navigate through the pages in the report by either clicking on the pages listed below, or by using the keyword search tool below to find specific information within the annual report.-
 1
1 -
2
-
3
-
4
-
5
-
6
-
7
-
8
-
9
-
10
-
11
-
12
-
13
-
14
-
15
-
16
-
17
-
18
-
19
-
20
-
21
-
22
-
23
-
24
-
25
-
26
-
27
-
28
-
29
-
30
-
31
-
32
-
33
-
34
-
35
-
36
-
37
-
 38
38 -
 39
39 -
 40
40 -
 41
41 -
 42
42 -
 43
43 -
 44
44 -
 45
45 -
 46
46 -
 47
47 -
 48
48 -
 49
49 -
 50
50 -
 51
51 -
 52
52 -
 53
53 -
 54
54 -
 55
55 -
 56
56 -
 57
57 -
 58
58 -
59
-
60
-
61
-
62
-
63
-
64
-
65
-
66
-
67
-
68
-
69
-
70
-
71
-
72
-
73
-
74
-
75
-
76
-
77
-
78
-
79
-
80
-
81
-
82
-
83
-
84
-
85
-
86
-
87
-
88
-
89
-
90
-
91
-
92
-
93
-
94
-
95
-
96
-
97
-
98
-
99
-
100
-
101
-
102
-
103
-
104
-
105
-
106
-
107
-
108
-
109
-
110
-
111
-
112
-
113
-
114
-
115
-
116
-
117
-
118
-
119
-
120
-
121
-
122
-
123
-
124
-
125
-
126
-
127
-
128
-
129
-
130
-
131
 |
 |
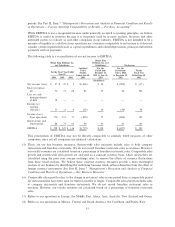
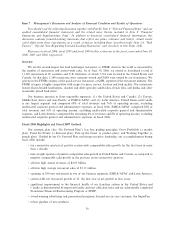
Item 7. Management's Discussion and Analysis of Financial Condition and Results of Operations
You should read the following discussion together with Part II, Item 6 ""Selected Financial Data'' and our
audited consolidated financial statements and the related notes thereto included in Item 8 ""Financial
Statements and Supplementary Data''. In addition to historical consolidated financial information, this
discussion contains forward-looking statements that reflect our plans, estimates and beliefs. Actual results
could differ from these expectations as a result of factors including those described under Item 1A, ""Risk
Factors'', ""Special Note Regarding Forward-Looking Statements'' and elsewhere in this Form 10-K.
References to fiscal 2006, fiscal 2005 and fiscal 2004 in this section are to the fiscal years ended June 30,
2006, 2005 and 2004, respectively.
Overview
We are the second largest fast food hamburger restaurant, or FFHR, chain in the world as measured by
the number of restaurants and system-wide sales. As of June 30, 2006, we owned or franchised a total of
11,129 restaurants in 65 countries and U.S. territories, of which 7,534 were located in the United States and
Canada. At that date, 1,240 restaurants were company-owned and 9,889 were owned by our franchisees. We
operate in the FFHR category of the quick service restaurant, or QSR, segment of the restaurant industry. The
FFHR category is highly competitive with respect to price, service, location and food quality. Our restaurants
feature flame-broiled hamburgers, chicken and other specialty sandwiches, french fries, soft drinks and other
reasonably-priced food items.
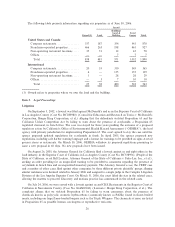
Our business operates in three reportable segments: (1) the United States and Canada; (2) Europe,
Middle East, Africa and Asia Pacific, or EMEA/APAC; and (3) Latin America. United States and Canada
is our largest segment and comprised 68% of total revenues and 76% of operating income, excluding
unallocated corporate general and administrative expenses, in fiscal 2006. EMEA/APAC comprised 28% of
total revenues and 16% of operating income, excluding unallocated corporate general and administrative
expenses, and Latin America comprised the remaining 4% of revenues and 8% of operating income, excluding
unallocated corporate general and administrative expenses, in fiscal 2006.
Fiscal 2006 Highlights and Fiscal 2007 Outlook
Our strategic plan (the ""Go Forward Plan'') has four guiding principles: Grow Profitably (a market
plan); Fund the Future (a financial plan); Fire-up the Guest (a product plan); and Working Together (a
people plan). Guided by our Go Forward Plan and strong executive leadership, our accomplishments during
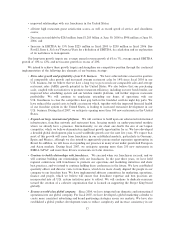
fiscal 2006 include:
‚ ten consecutive quarters of positive system-wide comparables sales growth for the first time in more
than a decade;
‚ nine straight quarters of positive comparable sales growth in United States and Canada, as compared to
negative comparable sales growth in the previous seven consecutive quarters;
‚ all-time high annual revenues of $2.05 billion;
‚ all-time high average restaurant sales of $1.13 million;
‚ openings of 290 new restaurants in two of our business segments, EMEA/APAC and Latin America;
‚ system-wide net restaurant growth of 25, the first year of net growth in four years;
‚ significant improvement in the financial health of our franchise system in the United States and
Canada as demonstrated by improved royalty and rent collection rates and our substantially completed
Franchisee Financial Restructuring Program or FFRP;
‚ award-winning advertising and promotional programs focused on our core customer, the SuperFan;
‚ robust pipeline of new products;
36