Burger King 2006 Annual Report Download - page 66
Download and view the complete annual report
Please find page 66 of the 2006 Burger King annual report below. You can navigate through the pages in the report by either clicking on the pages listed below, or by using the keyword search tool below to find specific information within the annual report.-
 1
1 -
2
-
3
-
4
-
5
-
6
-
7
-
8
-
9
-
10
-
11
-
12
-
13
-
14
-
15
-
16
-
17
-
18
-
19
-
20
-
21
-
22
-
23
-
24
-
25
-
26
-
27
-
28
-
29
-
30
-
31
-
32
-
33
-
34
-
35
-
36
-
37
-
38
-
39
-
40
-
41
-
42
-
43
-
44
-
45
-
46
-
47
-
48
-
49
-
50
-
51
-
52
-
53
-
54
-
55
-
 56
56 -
 57
57 -
 58
58 -
 59
59 -
 60
60 -
 61
61 -
 62
62 -
 63
63 -
 64
64 -
 65
65 -
 66
66 -
 67
67 -
 68
68 -
 69
69 -
 70
70 -
 71
71 -
 72
72 -
 73
73 -
 74
74 -
 75
75 -
 76
76 -
77
-
78
-
79
-
80
-
81
-
82
-
83
-
84
-
85
-
86
-
87
-
88
-
89
-
90
-
91
-
92
-
93
-
94
-
95
-
96
-
97
-
98
-
99
-
100
-
101
-
102
-
103
-
104
-
105
-
106
-
107
-
108
-
109
-
110
-
111
-
112
-
113
-
114
-
115
-
116
-
117
-
118
-
119
-
120
-
121
-
122
-
123
-
124
-
125
-
126
-
127
-
128
-
129
-
130
-
131
 |
 |

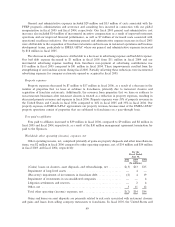
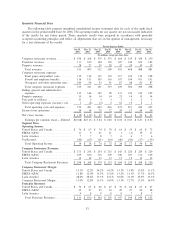
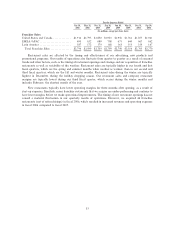
Our quarterly results also fluctuate due to the timing of expenses and charges associated with franchise
system distress, our global reorganization, gains and losses on asset and business disposals, impairment charges
and settlement losses recorded in connection with acquisitions of franchise restaurants. Unusual charges
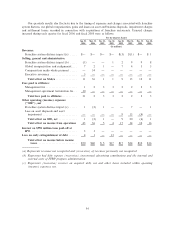
incurred during each quarter for fiscal 2006 and fiscal 2005 were as follows:
For the Quarters Ended
Jun 30, Mar 31, Dec 31, Sep 30, Jun 30, Mar 31, Dec 31, Sep 30,
2006 2006 2005 2005 2005 2005 2004 2004
(In millions)
Revenues:
Franchise system distress impact(a) ÏÏÏÏÏ $Ì $Ì $Ì $Ì $(3) $(1) $Ì $ 1
Selling, general and administrative:
Franchise system distress impact(b) ÏÏÏÏÏ (1) Ì Ì 1 2 9 9 8
Global reorganization and realignmentÏÏÏÏ 7 2 1 Ì 7 4 3 3
Compensatory make-whole payment ÏÏÏÏÏ Ì 34 Ì Ì Ì Ì Ì Ì
Executive severance ÏÏÏÏÏÏÏÏÏÏÏÏÏÏÏÏÏÏÏ 5 Ì Ì Ì Ì Ì Ì Ì
Total effect on SG&A ÏÏÏÏÏÏÏÏÏÏÏÏÏÏÏ 11 36 1 1 9 13 12 11
Fees paid to affiliates:
Management fee ÏÏÏÏÏÏÏÏÏÏÏÏÏÏÏÏÏÏÏÏÏÏ 1 2 3 3 2 2 2 3
Management agreement termination fee ÏÏ 30 Ì Ì Ì Ì Ì Ì Ì
Total fees paid to affiliatesÏÏÏÏÏÏÏÏÏÏÏ 31 2 3 3 2 2 2 3
Other operating (income) expenses:
(""OIE''), net
Franchise system distress impact(c) ÏÏÏÏÏ 1 (2) 1 Ì Ì 7 Ì 1
Loss on asset disposals and asset
impairment ÏÏÏÏÏÏÏÏÏÏÏÏÏÏÏÏÏÏÏÏÏÏÏÏ Ì Ì Ì Ì 9 13 (4) Ì
Total effect on OIE, net ÏÏÏÏÏÏÏÏÏÏÏÏÏ 1 (2) 1 Ì 9 20 (4) 1
Total effect on income from operations 43 36 5 4 17 34 10 16
Interest on $350 million loan paid-off at
IPOÏÏÏÏÏÏÏÏÏÏÏÏÏÏÏÏÏÏÏÏÏÏÏÏÏÏÏÏÏÏÏÏÏ 3 3 Ì Ì Ì Ì Ì Ì
Loss on early extinguishment of debt ÏÏÏÏÏÏ 4 1 Ì 13 Ì Ì Ì Ì
Total effect on income before income
taxesÏÏÏÏÏÏÏÏÏÏÏÏÏÏÏÏÏÏÏÏÏÏÏÏÏÏÏÏ $50 $40 $ 5 $17 $17 $34 $10 $16
(a) Represents revenues not recognized and (recoveries) of revenues previously not recognized.
(b) Represents bad debt expense (recoveries), incremental advertising contributions and the internal and
external costs of FFRP program administration.
(c) Represents (recoveries) reserves on acquired debt, net and other items included within operating
(income) expenses, net.
54