Burger King 2006 Annual Report Download - page 62
Download and view the complete annual report
Please find page 62 of the 2006 Burger King annual report below. You can navigate through the pages in the report by either clicking on the pages listed below, or by using the keyword search tool below to find specific information within the annual report.-
 1
1 -
2
-
3
-
4
-
5
-
6
-
7
-
8
-
9
-
10
-
11
-
12
-
13
-
14
-
15
-
16
-
17
-
18
-
19
-
20
-
21
-
22
-
23
-
24
-
25
-
26
-
27
-
28
-
29
-
30
-
31
-
32
-
33
-
34
-
35
-
36
-
37
-
38
-
39
-
40
-
41
-
42
-
43
-
44
-
45
-
46
-
47
-
48
-
49
-
50
-
51
-
 52
52 -
 53
53 -
 54
54 -
 55
55 -
 56
56 -
 57
57 -
 58
58 -
 59
59 -
 60
60 -
 61
61 -
 62
62 -
 63
63 -
 64
64 -
 65
65 -
 66
66 -
 67
67 -
 68
68 -
 69
69 -
 70
70 -
 71
71 -
 72
72 -
73
-
74
-
75
-
76
-
77
-
78
-
79
-
80
-
81
-
82
-
83
-
84
-
85
-
86
-
87
-
88
-
89
-
90
-
91
-
92
-
93
-
94
-
95
-
96
-
97
-
98
-
99
-
100
-
101
-
102
-
103
-
104
-
105
-
106
-
107
-
108
-
109
-
110
-
111
-
112
-
113
-
114
-
115
-
116
-
117
-
118
-
119
-
120
-
121
-
122
-
123
-
124
-
125
-
126
-
127
-
128
-
129
-
130
-
131
 |
 |
Canada recorded $7 million in net losses on asset disposals compared to $6 million in fiscal 2004. EMEA/
APAC recorded $6 million in net losses on asset disposals in fiscal 2005, compared to $8 million in fiscal 2004,
including a loss of $3 million recorded in connection with the refranchising of company restaurants in Sweden.
As a result of our assessments of the net realizable value of certain third-party debt of franchisees that we
acquired, primarily in connection with the FFRP program in the United States and Canada, we recorded
$4 million and $12 million of impairment charges related to investments in franchisee debt in fiscal 2005 and
fiscal 2004, respectively. The remaining fiscal 2004 impairment of debt investments was recorded in
connection with the forgiveness of a note receivable from an unconsolidated affiliate in Australia.
Other, net included $5 million of settlement losses recorded in connection with the acquisition of
franchise restaurants and $4 million of costs associated with the FFRP program in fiscal 2005 in the United
States and Canada. In fiscal 2004, other, net included $3 million of losses from unconsolidated investments in
EMEA/APAC and $2 million each of losses from transactions denominated in foreign currencies, property
valuation reserves, and re-branding costs related to our operations in Asia.
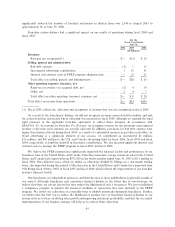
Operating income
Operating income increased by $19 million to $170 million in fiscal 2006, primarily as a result of
improved restaurant sales and the improved financial health of our franchise system, partially offset by the
effect of the compensatory make-whole payment and the management agreement termination fee. See
Note 20 to our audited consolidated financial statements contained in this report for segment information
disclosed in accordance with Statement of Financial Accounting Standards No. 131, Disclosures about
Segments of an Enterprise and Related Information (SFAS No 131). In fiscal 2005, our operating income
increased by $78 million to $151 million, primarily as a result of increased revenues and the improved financial
health of our franchise system.
In the United States and Canada, operating income increased by $40 million to $295 million in fiscal
2006, primarily as a result of increased sales and reductions in the negative effect of franchise system distress,
which decreased by $33 million. The decrease in the negative effect of franchise system distress was
comprised primarily of a $14 million reduction in incremental advertising contributions and a $12 million
reduction in costs of FFRP administration, both of which resulted from the improved financial health of our
franchise system. In fiscal 2005, operating income increased by $140 million to $255 million, primarily as a
result of increased revenues and a reduction in the negative effect of franchise system distress, which
decreased by $72 million. This decrease was comprised primarily of a $25 million increase in franchise and
property revenue recognition, a $26 million reduction in incremental advertising contributions and a
$15 million reduction in reserves on acquired debt, all of which resulted from the improved financial health of
our franchise system.
Operating income in EMEA/APAC increased by $26 million to $62 million in fiscal 2006, as a result of a
$6 million reduction in losses on property disposals, a $16 million decrease in selling, general and
administrative expenses, primarily attributable to the effects of our global reorganization and a $5 million
increase in franchise revenues, partially offset by a $7 million decrease in margins from company restaurants
driven primarily by results in the United Kingdom, due to decreased sales, increased beef prices and
occupancy costs, including rents and utilities. In fiscal 2005, operating income decreased by $59 million to
$36 million, as a result of a number of factors, including: (i) a $16 million decrease in margins from company
restaurants, as a result of higher operating costs, (ii) a $12 million increase in selling, general and
administrative expenses to support growth, (iii) a $6 million increase in expenses related to our global
reorganization, (iv) $9 million of lease termination and exit costs, including $8 million in the United
Kingdom, and (v) $2 million of litigation settlement costs in Asia.
Operating income in Latin America increased by $4 million to $29 million in fiscal 2006, primarily as a
result of increased revenues. In fiscal 2005, operating income decreased by $1 million to $25 million, primarily
as a result of higher company restaurant expenses.
50