Burger King 2006 Annual Report Download - page 44
Download and view the complete annual report
Please find page 44 of the 2006 Burger King annual report below. You can navigate through the pages in the report by either clicking on the pages listed below, or by using the keyword search tool below to find specific information within the annual report.-
 1
1 -
2
-
3
-
4
-
5
-
6
-
7
-
8
-
9
-
10
-
11
-
12
-
13
-
14
-
15
-
16
-
17
-
18
-
19
-
20
-
21
-
22
-
23
-
24
-
25
-
26
-
27
-
28
-
29
-
30
-
31
-
32
-
33
-
 34
34 -
 35
35 -
 36
36 -
 37
37 -
 38
38 -
 39
39 -
 40
40 -
 41
41 -
 42
42 -
 43
43 -
 44
44 -
 45
45 -
 46
46 -
 47
47 -
 48
48 -
 49
49 -
 50
50 -
 51
51 -
 52
52 -
 53
53 -
 54
54 -
55
-
56
-
57
-
58
-
59
-
60
-
61
-
62
-
63
-
64
-
65
-
66
-
67
-
68
-
69
-
70
-
71
-
72
-
73
-
74
-
75
-
76
-
77
-
78
-
79
-
80
-
81
-
82
-
83
-
84
-
85
-
86
-
87
-
88
-
89
-
90
-
91
-
92
-
93
-
94
-
95
-
96
-
97
-
98
-
99
-
100
-
101
-
102
-
103
-
104
-
105
-
106
-
107
-
108
-
109
-
110
-
111
-
112
-
113
-
114
-
115
-
116
-
117
-
118
-
119
-
120
-
121
-
122
-
123
-
124
-
125
-
126
-
127
-
128
-
129
-
130
-
131
 |
 |

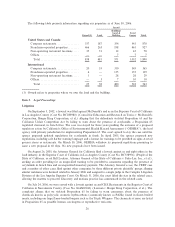
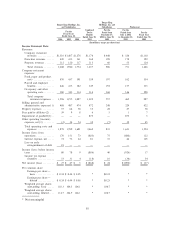
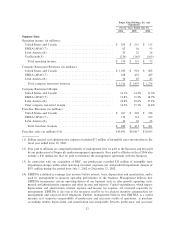
Burger King Holdings, Inc. and
Subsidiaries
For the Years Ended June 30,
2006 2005 2004
Segment Data:
Operating income (in millions):
United States and Canada ÏÏÏÏÏÏÏÏÏÏÏÏÏÏÏÏÏÏÏÏÏÏÏÏÏÏÏÏÏÏÏÏÏÏÏÏÏÏÏ $ 295 $ 255 $ 115
EMEA/APAC(7) ÏÏÏÏÏÏÏÏÏÏÏÏÏÏÏÏÏÏÏÏÏÏÏÏÏÏÏÏÏÏÏÏÏÏÏÏÏÏÏÏÏÏÏÏÏ 62 36 95
Latin America(8) ÏÏÏÏÏÏÏÏÏÏÏÏÏÏÏÏÏÏÏÏÏÏÏÏÏÏÏÏÏÏÏÏÏÏÏÏÏÏÏÏÏÏÏÏÏÏ 29 25 26
Unallocated(9) ÏÏÏÏÏÏÏÏÏÏÏÏÏÏÏÏÏÏÏÏÏÏÏÏÏÏÏÏÏÏÏÏÏÏÏÏÏÏÏÏÏÏÏÏÏÏÏÏ (216) (165) (163)
Total operating incomeÏÏÏÏÏÏÏÏÏÏÏÏÏÏÏÏÏÏÏÏÏÏÏÏÏÏÏÏÏÏÏÏÏÏÏÏÏÏÏÏ $ 170 $ 151 $ 73
Company Restaurant Revenues (in millions):
United States and Canada ÏÏÏÏÏÏÏÏÏÏÏÏÏÏÏÏÏÏÏÏÏÏÏÏÏÏÏÏÏÏÏÏÏÏÏÏÏÏÏ $ 1,032 $ 923 $ 802
EMEA/APAC(7) ÏÏÏÏÏÏÏÏÏÏÏÏÏÏÏÏÏÏÏÏÏÏÏÏÏÏÏÏÏÏÏÏÏÏÏÏÏÏÏÏÏÏÏÏÏ 428 435 429
Latin America(8) ÏÏÏÏÏÏÏÏÏÏÏÏÏÏÏÏÏÏÏÏÏÏÏÏÏÏÏÏÏÏÏÏÏÏÏÏÏÏÏÏÏÏÏÏÏÏ 56 49 45
Total company restaurant revenuesÏÏÏÏÏÏÏÏÏÏÏÏÏÏÏÏÏÏÏÏÏÏÏÏÏÏÏÏÏÏ $ 1,516 $ 1,407 $ 1,276
Company Restaurant Margin:
United States and Canada ÏÏÏÏÏÏÏÏÏÏÏÏÏÏÏÏÏÏÏÏÏÏÏÏÏÏÏÏÏÏÏÏÏÏÏÏÏÏÏ 14.1% 14.2% 11.3%
EMEA/APAC(7) ÏÏÏÏÏÏÏÏÏÏÏÏÏÏÏÏÏÏÏÏÏÏÏÏÏÏÏÏÏÏÏÏÏÏÏÏÏÏÏÏÏÏÏÏÏ 13.8% 15.2% 18.9%
Latin America(8) ÏÏÏÏÏÏÏÏÏÏÏÏÏÏÏÏÏÏÏÏÏÏÏÏÏÏÏÏÏÏÏÏÏÏÏÏÏÏÏÏÏÏÏÏÏÏ 26.8% 30.6% 37.8%
Total company restaurant margin ÏÏÏÏÏÏÏÏÏÏÏÏÏÏÏÏÏÏÏÏÏÏÏÏÏÏÏÏÏÏÏÏÏ 14.5% 15.1% 14.8%
Franchise Revenues (in millions):
United States and Canada ÏÏÏÏÏÏÏÏÏÏÏÏÏÏÏÏÏÏÏÏÏÏÏÏÏÏÏÏÏÏÏÏÏÏÏÏÏÏÏ $ 267 $ 269 $ 234
EMEA/APAC(7) ÏÏÏÏÏÏÏÏÏÏÏÏÏÏÏÏÏÏÏÏÏÏÏÏÏÏÏÏÏÏÏÏÏÏÏÏÏÏÏÏÏÏÏÏÏ 119 114 102
Latin America(8) ÏÏÏÏÏÏÏÏÏÏÏÏÏÏÏÏÏÏÏÏÏÏÏÏÏÏÏÏÏÏÏÏÏÏÏÏÏÏÏÏÏÏÏÏÏÏ 34 30 25
Total franchise revenuesÏÏÏÏÏÏÏÏÏÏÏÏÏÏÏÏÏÏÏÏÏÏÏÏÏÏÏÏÏÏÏÏÏÏÏÏÏÏÏ $ 420 $ 413 $ 361
Franchise sales (in millions)(10) ÏÏÏÏÏÏÏÏÏÏÏÏÏÏÏÏÏÏÏÏÏÏÏÏÏÏÏÏÏÏÏÏÏÏÏ $10,903 $10,817 $10,055
(1) Selling, general and administrative expenses included $72 million of intangible asset amortization in the
fiscal year ended June 30, 2002.
(2) Fees paid to affiliates are comprised primarily of management fees we paid to the Sponsors and fees paid
by our predecessor to Diageo plc under management agreements. Fees paid to affiliates in fiscal 2006 also
include a $30 million fee that we paid to terminate the management agreement with the Sponsors.
(3) In connection with our acquisition of BKC, our predecessor recorded $35 million of intangible asset
impairment charges within other operating (income) expenses, net and goodwill impairment charges of
$875 million during the period from July 1, 2002 to December 12, 2002.
(4) EBITDA is defined as earnings (net income) before interest, taxes, depreciation and amortization, and is
used by management to measure operating performance of the business. Management believes that
EBITDA incorporates certain operating drivers of our business such as sales growth, operating costs,
general and administrative expenses and other income and expense. Capital expenditures, which impact
depreciation and amortization, interest expense and income tax expense, are reviewed separately by
management. EBITDA is also one of the measures used by us to calculate incentive compensation for
management and corporate-level employees. Further, management believes that EBITDA is a useful
measure as it improves comparability of predecessor and successor results of operations, as purchase
accounting renders depreciation and amortization non-comparable between predecessor and successor
32