Burger King 2006 Annual Report Download - page 58
Download and view the complete annual report
Please find page 58 of the 2006 Burger King annual report below. You can navigate through the pages in the report by either clicking on the pages listed below, or by using the keyword search tool below to find specific information within the annual report.-
 1
1 -
2
-
3
-
4
-
5
-
6
-
7
-
8
-
9
-
10
-
11
-
12
-
13
-
14
-
15
-
16
-
17
-
18
-
19
-
20
-
21
-
22
-
23
-
24
-
25
-
26
-
27
-
28
-
29
-
30
-
31
-
32
-
33
-
34
-
35
-
36
-
37
-
38
-
39
-
40
-
41
-
42
-
43
-
44
-
45
-
46
-
47
-
 48
48 -
 49
49 -
 50
50 -
 51
51 -
 52
52 -
 53
53 -
 54
54 -
 55
55 -
 56
56 -
 57
57 -
 58
58 -
 59
59 -
 60
60 -
 61
61 -
 62
62 -
 63
63 -
 64
64 -
 65
65 -
 66
66 -
 67
67 -
 68
68 -
69
-
70
-
71
-
72
-
73
-
74
-
75
-
76
-
77
-
78
-
79
-
80
-
81
-
82
-
83
-
84
-
85
-
86
-
87
-
88
-
89
-
90
-
91
-
92
-
93
-
94
-
95
-
96
-
97
-
98
-
99
-
100
-
101
-
102
-
103
-
104
-
105
-
106
-
107
-
108
-
109
-
110
-
111
-
112
-
113
-
114
-
115
-
116
-
117
-
118
-
119
-
120
-
121
-
122
-
123
-
124
-
125
-
126
-
127
-
128
-
129
-
130
-
131
 |
 |
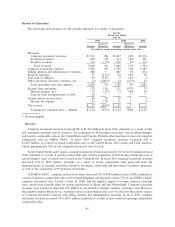
In Latin America, company restaurant revenues increased 14% to $56 million in fiscal 2006, as revenues
generated by nine new company restaurants, partially offset by negative comparable sales. In fiscal 2005,
company restaurant revenues increased 8% to $49 million, primarily as a result of new restaurant openings and
positive comparable sales.
Franchise revenues increased 2% to $420 million in fiscal 2006. Comparable sales increased at franchise
restaurants in the United States and Canada and Latin America segments and decreased in the EMEA/
APAC segment during fiscal 2006. In addition, 326 new franchise restaurants were opened since June 30,
2005, including 277 new international franchise restaurants. Partially offsetting these factors was the
elimination of royalties from 360 franchise restaurants that were closed or acquired by us, primarily in the
United States and Canada. In fiscal 2005, franchise revenues increased 14% to $413 million, primarily as a
result of improved sales at franchise restaurants in all segments.
In the United States and Canada, franchise revenues decreased 1% to $267 million in fiscal 2006,
primarily as a result of the elimination of royalties from 278 franchise restaurants that were closed or acquired
by us, partially offset by positive comparable sales. In fiscal 2005, franchise revenues increased 15% to
$269 million, primarily as a result of the implementation of our menu, marketing and operational excellence
initiatives and the improved financial condition of our franchise system. In addition to increased royalties from
improved franchise restaurant sales, we recognized $3 million of franchise revenues not previously recognized
in United States and Canada in fiscal 2005, compared to $17 million of franchise revenues not recognized in
fiscal 2004. Partially offsetting these factors was the elimination of royalties from franchise restaurants that
were closed or acquired by us in fiscal 2005.
Our EMEA/APAC franchisees opened 125 new franchise restaurants (net of closures) since June 30,
2005 resulting in a 4% increase in franchise revenues to $119 million in fiscal 2006. In fiscal 2005, our
franchisees opened 64 new franchise restaurants (net of closures) in EMEA/APAC which, along with
positive comparable sales, resulted in a 13% increase in franchise revenues to $114 million.
Latin America franchise revenues increased 13% to $34 million during fiscal 2006 as a result of 71 new
franchise restaurants (net of closures) since June 30, 2005 and positive comparable sales. In fiscal 2005,
franchise revenues increased 17% to $30 million, as a result of 53 new franchise restaurants (net of closures)
and positive comparable sales.
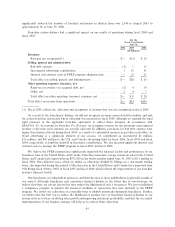
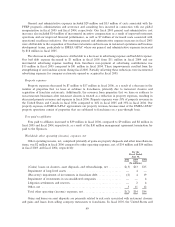
Property revenues decreased by 7% to $112 million in fiscal 2006, as a result of a decrease in the number
of properties that we lease or sublease to franchisees due to franchise restaurants that were closed or acquired
by us, partially offset by higher contingent rent payments. In fiscal 2005, property revenues increased 3% to
$120 million.
In the United States and Canada, property revenues were $83 million in fiscal 2006 and fiscal 2005,
primarily as a result of higher contingent rent payments from increased franchise restaurant sales, offset by the
effect of franchise restaurants leased to franchisees that were closed or acquired by us. In fiscal 2005, property
revenues increased 1% to $83 million primarily because fiscal 2004 property revenues in the United States and
Canada excluded $5 million of property revenues not recognized, partially offset by $3 million of revenues
recognized in connection with finalizing our purchase accounting allocations.
Our EMEA/APAC property revenues decreased $8 million to $29 million, primarily as a result of the
closure of franchise restaurants in the United Kingdom and the reclassification of property income on certain
properties that were leased or subleased to non-restaurant businesses after restaurant closures. The property
income on these properties is treated as a reduction in related property expenses rather than revenue. In fiscal
2005, property revenues increased 5% to $37 million.
Operating Costs and Expenses
Company restaurant expenses
Food, paper and product costs increased 8% to $470 million in fiscal 2006, primarily as a result of an 8%
increase in company restaurant revenues. As a percentage of company restaurant revenues, food, paper and
46