Burger King 2006 Annual Report Download - page 70
Download and view the complete annual report
Please find page 70 of the 2006 Burger King annual report below. You can navigate through the pages in the report by either clicking on the pages listed below, or by using the keyword search tool below to find specific information within the annual report.-
 1
1 -
2
-
3
-
4
-
5
-
6
-
7
-
8
-
9
-
10
-
11
-
12
-
13
-
14
-
15
-
16
-
17
-
18
-
19
-
20
-
21
-
22
-
23
-
24
-
25
-
26
-
27
-
28
-
29
-
30
-
31
-
32
-
33
-
34
-
35
-
36
-
37
-
38
-
39
-
40
-
41
-
42
-
43
-
44
-
45
-
46
-
47
-
48
-
49
-
50
-
51
-
52
-
53
-
54
-
55
-
56
-
57
-
58
-
59
-
 60
60 -
 61
61 -
 62
62 -
 63
63 -
 64
64 -
 65
65 -
 66
66 -
 67
67 -
 68
68 -
 69
69 -
 70
70 -
 71
71 -
 72
72 -
 73
73 -
 74
74 -
 75
75 -
 76
76 -
 77
77 -
 78
78 -
 79
79 -
 80
80 -
81
-
82
-
83
-
84
-
85
-
86
-
87
-
88
-
89
-
90
-
91
-
92
-
93
-
94
-
95
-
96
-
97
-
98
-
99
-
100
-
101
-
102
-
103
-
104
-
105
-
106
-
107
-
108
-
109
-
110
-
111
-
112
-
113
-
114
-
115
-
116
-
117
-
118
-
119
-
120
-
121
-
122
-
123
-
124
-
125
-
126
-
127
-
128
-
129
-
130
-
131
 |
 |

balance sheet. This tax liability was partially offset by $40 million through the utilization of net operating loss
carryforwards and other foreign tax credits, resulting in a cash tax obligation of $86 million, which we expect
to make in the first quarter of fiscal 2007.
In accordance with the guidance provided by ARB 51, Consolidated Financial Statements, the resulting
tax amount of $126 million was recorded as a prepaid tax asset and offset by the reversal of a $105 million
deferred tax liability, which we had previously recorded associated with the transferred asset resulting in a net
prepaid asset of $21 million.
We incurred consulting, legal, information technology, finance and relocation costs of approximately
$10 million during fiscal 2006 to implement this realignment. The relocation costs were incurred in connection
with the relocation of certain key officers, finance, accounting and legal staff of the EMEA/APAC businesses
to locations within Europe and Asia.
Contractual Obligations and Commitments
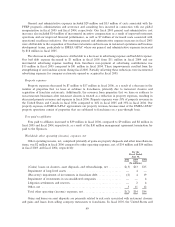
The following table presents information relating to our contractual obligations as of June 30, 2006:
Payment Due by Period
Less Than More Than
Contractual Obligations Total 1 Year 1-3 Years 3-5 Years 5 Years
(In millions)
Capital lease obligations ÏÏÏÏÏÏÏÏÏÏÏÏÏÏ $ 134 $ 13 $ 25 $ 22 $ 74
Operating lease obligations(1) ÏÏÏÏÏÏÏÏÏ 1,391 153 275 231 732
Long-term debt, including current
portion and interest(2) ÏÏÏÏÏÏÏÏÏÏÏÏÏ 1,354 64 164 273 853
Purchase commitments(3) ÏÏÏÏÏÏÏÏÏÏÏÏ 56 56 Ì Ì Ì
Total ÏÏÏÏÏÏÏÏÏÏÏÏÏÏÏÏÏÏÏÏÏÏÏÏÏÏÏÏ $2,935 $286 $464 $526 $1,659
(1) Operating lease obligations include lease payments for company restaurants and franchise restaurants
that sublease the property from us. Rental income from these franchisees was $88 million and $91 million
for fiscal 2006 and fiscal 2005, respectively.
(2) We have estimated our interest payments based on (i) projected LIBOR rates, (ii) the portion of our
debt we converted to fixed rates through interest rate swaps and (iii) the amortization schedule of the
debt.
(3) Includes commitments to purchase advertising and other marketing services from third parties in advance
on behalf of the Burger King system and obligations related to information technology service
agreements.
As of June 30, 2006, we leased 1,090 properties to franchisees and other third parties. At June 30, 2006,
we also leased land, buildings, office space and warehousing under operating leases, and leased or subleased
land and buildings that we own or lease, respectively, to franchisees under operating leases. In addition to the
minimum obligations included in the table above, contingent rentals may be payable under certain leases on
the basis of a percentage of sales in excess of stipulated amounts. See Note 15 to our audited consolidated
financial statements for further information about our leasing arrangements.
As of June 30, 2006, the projected benefit obligation of our defined benefit pension plans exceeded
pension assets by $67 million. We use the Moody's long-term corporate bond yield indices for Aa bonds
(""Moody's Aa rate''), plus an additional 25 basis points to reflect the longer duration of our plans, as the
discount rate used in the calculation of the projected benefit obligation as of the measurement date. We made
contributions totaling $2 million into our pension plans and estimated benefit payments of $4 million out of
these plans during fiscal 2006. Estimates of reasonably likely future pension contributions are dependent on
pension asset performance, future interest rates, future tax law changes, and future changes in regulatory
funding requirements.
58