Burger King 2006 Annual Report Download - page 43
Download and view the complete annual report
Please find page 43 of the 2006 Burger King annual report below. You can navigate through the pages in the report by either clicking on the pages listed below, or by using the keyword search tool below to find specific information within the annual report.-
 1
1 -
2
-
3
-
4
-
5
-
6
-
7
-
8
-
9
-
10
-
11
-
12
-
13
-
14
-
15
-
16
-
17
-
18
-
19
-
20
-
21
-
22
-
23
-
24
-
25
-
26
-
27
-
28
-
29
-
30
-
31
-
32
-
 33
33 -
 34
34 -
 35
35 -
 36
36 -
 37
37 -
 38
38 -
 39
39 -
 40
40 -
 41
41 -
 42
42 -
 43
43 -
 44
44 -
 45
45 -
 46
46 -
 47
47 -
 48
48 -
 49
49 -
 50
50 -
 51
51 -
 52
52 -
 53
53 -
54
-
55
-
56
-
57
-
58
-
59
-
60
-
61
-
62
-
63
-
64
-
65
-
66
-
67
-
68
-
69
-
70
-
71
-
72
-
73
-
74
-
75
-
76
-
77
-
78
-
79
-
80
-
81
-
82
-
83
-
84
-
85
-
86
-
87
-
88
-
89
-
90
-
91
-
92
-
93
-
94
-
95
-
96
-
97
-
98
-
99
-
100
-
101
-
102
-
103
-
104
-
105
-
106
-
107
-
108
-
109
-
110
-
111
-
112
-
113
-
114
-
115
-
116
-
117
-
118
-
119
-
120
-
121
-
122
-
123
-
124
-
125
-
126
-
127
-
128
-
129
-
130
-
131
 |
 |

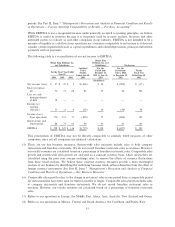
Burger King
Burger King Holdings, Inc. Holdings, Inc. and
and Subsidiaries Subsidiaries Predecessor
Combined For the For the
Twelve Period from Period from For the
For the Fiscal Year Ended Months December 13, July 1, 2002 Fiscal Year
June 30, Ended June 30, 2002 to June 30, to December 12, Ended June 30,
2006 2005 2004 2003 2003 2002 2002
(In millions)
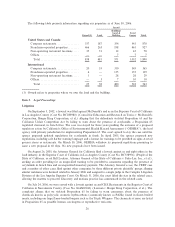
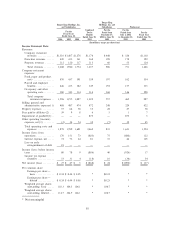
Other Financial Data:
Net cash provided by
operating activitiesÏÏÏÏÏÏÏ $ 74 $ 218 $ 199 $ 82 $ 81 $ 1 $ 212
Net cash used for investing
activities ÏÏÏÏÏÏÏÏÏÏÏÏÏÏÏ (74) (5) (184) (587) (485) (102) (349)
Net cash (used for)
provided by financing
activities ÏÏÏÏÏÏÏÏÏÏÏÏÏÏÏ (173) (2) 3 719 607 112 155
Capital expenditures ÏÏÏÏÏÏÏ 85 93 81 142 47 95 325
EBITDA(3)(4)ÏÏÏÏÏÏÏÏÏÏÏ $ 258 $ 225 $ 136 $ (719) $ 118 $ (837) $ 283
Burger King Holdings, Inc. and Subsidiaries Predecessor
As of June 30, As of June 30,
2006 2005 2004 2003 2002
(In millions)
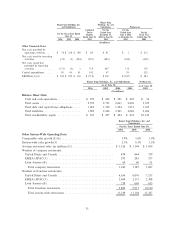
Balance Sheet Data:
Cash and cash equivalents ÏÏÏÏÏÏÏÏÏÏÏÏÏÏÏÏ $ 259 $ 432 $ 221 $ 203 $ 54
Total assets ÏÏÏÏÏÏÏÏÏÏÏÏÏÏÏÏÏÏÏÏÏÏÏÏÏÏÏÏ 2,552 2,723 2,665 2,458 3,329
Total debt and capital lease obligations ÏÏÏÏÏ 1,065 1,339 1,294 1,251 1,323
Total liabilitiesÏÏÏÏÏÏÏÏÏÏÏÏÏÏÏÏÏÏÏÏÏÏÏÏÏÏ 1,985 2,246 2,241 2,026 2,186
Total stockholders' equity ÏÏÏÏÏÏÏÏÏÏÏÏÏÏÏÏ $ 567 $ 477 $ 424 $ 432 $1,143
Burger King Holdings, Inc. and
Subsidiaries
For the Years Ended June 30,
2006 2005 2004
Other System-Wide Operating Data:
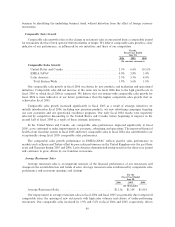
Comparable sales growth(5)(6) ÏÏÏÏÏÏÏÏÏÏÏÏÏÏÏÏÏÏÏÏÏÏÏÏÏÏÏÏÏÏÏÏÏÏÏÏ 1.9% 5.6% 1.0%
System-wide sales growth(5) ÏÏÏÏÏÏÏÏÏÏÏÏÏÏÏÏÏÏÏÏÏÏÏÏÏÏÏÏÏÏÏÏÏÏÏÏÏÏ 2.1% 6.1% 1.2%
Average restaurant sales (in millions)(5) ÏÏÏÏÏÏÏÏÏÏÏÏÏÏÏÏÏÏÏÏÏÏÏÏÏÏÏÏ $ 1.126 $ 1.104 $ 1.014
Number of company restaurants:
United States and Canada ÏÏÏÏÏÏÏÏÏÏÏÏÏÏÏÏÏÏÏÏÏÏÏÏÏÏÏÏÏÏÏÏÏÏÏÏÏÏÏ 878 844 759
EMEA/APAC(7) ÏÏÏÏÏÏÏÏÏÏÏÏÏÏÏÏÏÏÏÏÏÏÏÏÏÏÏÏÏÏÏÏÏÏÏÏÏÏÏÏÏÏÏÏÏ 293 283 277
Latin America(8) ÏÏÏÏÏÏÏÏÏÏÏÏÏÏÏÏÏÏÏÏÏÏÏÏÏÏÏÏÏÏÏÏÏÏÏÏÏÏÏÏÏÏÏÏÏÏ 69 60 51
Total company restaurants ÏÏÏÏÏÏÏÏÏÏÏÏÏÏÏÏÏÏÏÏÏÏÏÏÏÏÏÏÏÏÏÏÏÏÏÏÏ 1,240 1,187 1,087
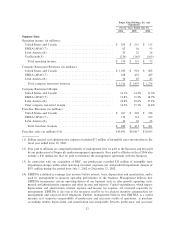
Number of franchise restaurants:
United States and Canada ÏÏÏÏÏÏÏÏÏÏÏÏÏÏÏÏÏÏÏÏÏÏÏÏÏÏÏÏÏÏÏÏÏÏÏÏÏÏÏ 6,656 6,876 7,217
EMEA/APAC(7) ÏÏÏÏÏÏÏÏÏÏÏÏÏÏÏÏÏÏÏÏÏÏÏÏÏÏÏÏÏÏÏÏÏÏÏÏÏÏÏÏÏÏÏÏÏ 2,494 2,373 2,308
Latin America(8) ÏÏÏÏÏÏÏÏÏÏÏÏÏÏÏÏÏÏÏÏÏÏÏÏÏÏÏÏÏÏÏÏÏÏÏÏÏÏÏÏÏÏÏÏÏÏ 739 668 615
Total franchise restaurants ÏÏÏÏÏÏÏÏÏÏÏÏÏÏÏÏÏÏÏÏÏÏÏÏÏÏÏÏÏÏÏÏÏÏÏÏÏ 9,889 9,917 10,140
Total system-wide restaurants ÏÏÏÏÏÏÏÏÏÏÏÏÏÏÏÏÏÏÏÏÏÏÏÏÏÏÏÏÏÏÏÏÏÏ 11,129 11,104 11,227
31