Burger King 2006 Annual Report Download - page 107
Download and view the complete annual report
Please find page 107 of the 2006 Burger King annual report below. You can navigate through the pages in the report by either clicking on the pages listed below, or by using the keyword search tool below to find specific information within the annual report.-
 1
1 -
2
-
3
-
4
-
5
-
6
-
7
-
8
-
9
-
10
-
11
-
12
-
13
-
14
-
15
-
16
-
17
-
18
-
19
-
20
-
21
-
22
-
23
-
24
-
25
-
26
-
27
-
28
-
29
-
30
-
31
-
32
-
33
-
34
-
35
-
36
-
37
-
38
-
39
-
40
-
41
-
42
-
43
-
44
-
45
-
46
-
47
-
48
-
49
-
50
-
51
-
52
-
53
-
54
-
55
-
56
-
57
-
58
-
59
-
60
-
61
-
62
-
63
-
64
-
65
-
66
-
67
-
68
-
69
-
70
-
71
-
72
-
73
-
74
-
75
-
76
-
77
-
78
-
79
-
80
-
81
-
82
-
83
-
84
-
85
-
86
-
87
-
88
-
89
-
90
-
91
-
92
-
93
-
94
-
95
-
96
-
 97
97 -
 98
98 -
 99
99 -
 100
100 -
 101
101 -
 102
102 -
 103
103 -
 104
104 -
 105
105 -
 106
106 -
 107
107 -
 108
108 -
 109
109 -
 110
110 -
 111
111 -
 112
112 -
 113
113 -
 114
114 -
 115
115 -
 116
116 -
 117
117 -
118
-
119
-
120
-
121
-
122
-
123
-
124
-
125
-
126
-
127
-
128
-
129
-
130
-
131
 |
 |

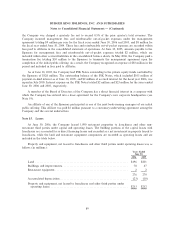
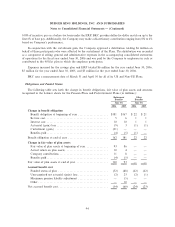
BURGER KING HOLDINGS, INC. AND SUBSIDIARIES
Notes to Consolidated Financial Statements Ì (Continued)
Retirement Other
Benefits Benefits
June 30, June 30,
2006 2005 2006 2005
Recognized in Statement of Financial Position
Accrued benefit liability ÏÏÏÏÏÏÏÏÏÏÏÏÏÏÏÏÏÏÏÏÏÏÏÏÏÏÏÏÏÏÏÏÏ (54) (55) (24) (23)
Accumulated other comprehensive lossÏÏÏÏÏÏÏÏÏÏÏÏÏÏÏÏÏÏÏÏÏ Ì (5) Ì Ì
Net accrued benefit cost ÏÏÏÏÏÏÏÏÏÏÏÏÏÏÏÏÏÏÏÏÏÏÏÏÏÏÏÏÏÏÏÏÏÏÏ $(54) $(60) $(24) $(23)
Additional year-end information for Pension Plans with accumulated benefit obligations in excess of
plan assets
The following sets forth the projected benefit obligation, accumulated benefit obligation, and fair value of
plan assets for the Pension Plans with accumulated benefit obligations in excess of plan assets (in millions):
Years Ended
June 30,
2006 2005
Projected benefit obligation ÏÏÏÏÏÏÏÏÏÏÏÏÏÏÏÏÏÏÏÏÏÏÏÏÏÏÏÏÏÏÏÏÏÏÏÏÏÏÏÏÏÏÏÏÏÏ $162 $181
Accumulated benefit obligation ÏÏÏÏÏÏÏÏÏÏÏÏÏÏÏÏÏÏÏÏÏÏÏÏÏÏÏÏÏÏÏÏÏÏÏÏÏÏÏÏÏÏÏ 155 153
Fair value of plan assets ÏÏÏÏÏÏÏÏÏÏÏÏÏÏÏÏÏÏÏÏÏÏÏÏÏÏÏÏÏÏÏÏÏÏÏÏÏÏÏÏÏÏÏÏÏÏÏÏÏ $110 $ 93
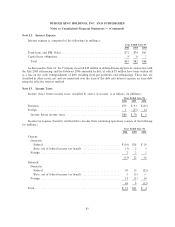
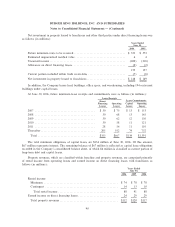
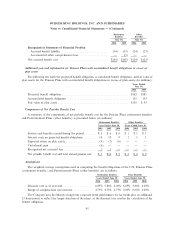
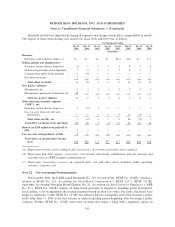
Components of Net Periodic Benefit Cost
A summary of the components of net periodic benefit cost for the Pension Plans (retirement benefits)
and Postretirement Plans (other benefits) is presented below (in millions):
Retirement Benefits Other Benefits
Years Ended June 30, Years Ended June 30,
2006 2005 2004 2006 2005 2004
Service cost-benefits earned during the periodÏÏÏÏÏÏÏÏ $ 5 $ 6 $ 6 $ 1 $ 1 $ 1
Interest costs on projected benefit obligations ÏÏÏÏÏÏÏÏ 10 109111
Expected return on plan assetsÏÏÏÏÏÏÏÏÏÏÏÏÏÏÏÏÏÏÏÏÏ (9) (7) (6) Ì Ì Ì
Curtailment gain ÏÏÏÏÏÏÏÏÏÏÏÏÏÏÏÏÏÏÏÏÏÏÏÏÏÏÏÏÏÏÏÏ (6) ÌÌÌÌÌ
Recognized net actuarial loss ÏÏÏÏÏÏÏÏÏÏÏÏÏÏÏÏÏÏÏÏÏÏ 1 1ÌÌÌÌ
Net periodic benefit cost and total annual pension cost ÏÏ $ 1 $10 $ 9 $ 2 $ 2 $ 2
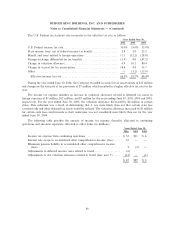
Assumptions
The weighted-average assumptions used in computing the benefit obligations of the U.S. Pension Plans
(retirement benefits) and Postretirement Plans (other benefits) are as follows:
Retirement Benefits Other Benefits
Years Ended June 30, Years Ended June 30,
2006 2005 2004 2006 2005 2004
Discount rate as of year-endÏÏÏÏÏÏÏÏÏÏÏÏÏÏÏÏÏÏÏÏÏ 6.09% 5.86% 6.00% 6.09% 5.86% 6.00%
Range of compensation rate increaseÏÏÏÏÏÏÏÏÏÏÏÏÏÏ 4.75% 4.75% 4.75% 0.00% 0.00% 0.00%
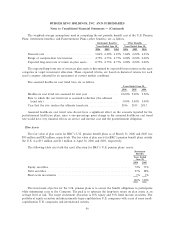
The Company uses the Moody's long-term corporate bond yield indices for Aa bonds plus an additional
25 basis points to reflect the longer duration of the plans, as the discount rate used in the calculation of the
benefit obligation.
95