Burger King 2006 Annual Report Download - page 57
Download and view the complete annual report
Please find page 57 of the 2006 Burger King annual report below. You can navigate through the pages in the report by either clicking on the pages listed below, or by using the keyword search tool below to find specific information within the annual report.-
 1
1 -
2
-
3
-
4
-
5
-
6
-
7
-
8
-
9
-
10
-
11
-
12
-
13
-
14
-
15
-
16
-
17
-
18
-
19
-
20
-
21
-
22
-
23
-
24
-
25
-
26
-
27
-
28
-
29
-
30
-
31
-
32
-
33
-
34
-
35
-
36
-
37
-
38
-
39
-
40
-
41
-
42
-
43
-
44
-
45
-
46
-
 47
47 -
 48
48 -
 49
49 -
 50
50 -
 51
51 -
 52
52 -
 53
53 -
 54
54 -
 55
55 -
 56
56 -
 57
57 -
 58
58 -
 59
59 -
 60
60 -
 61
61 -
 62
62 -
 63
63 -
 64
64 -
 65
65 -
 66
66 -
 67
67 -
68
-
69
-
70
-
71
-
72
-
73
-
74
-
75
-
76
-
77
-
78
-
79
-
80
-
81
-
82
-
83
-
84
-
85
-
86
-
87
-
88
-
89
-
90
-
91
-
92
-
93
-
94
-
95
-
96
-
97
-
98
-
99
-
100
-
101
-
102
-
103
-
104
-
105
-
106
-
107
-
108
-
109
-
110
-
111
-
112
-
113
-
114
-
115
-
116
-
117
-
118
-
119
-
120
-
121
-
122
-
123
-
124
-
125
-
126
-
127
-
128
-
129
-
130
-
131
 |
 |

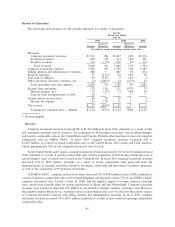
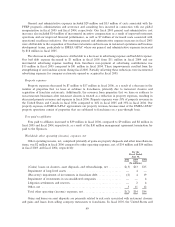
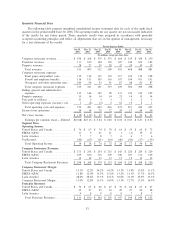
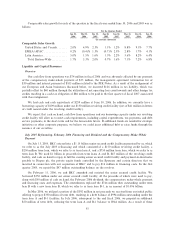
Results of Operations
The following table presents, for the periods indicated, our results of operations:
For the
Fiscal Year Ended
June 30,
2006 2005 2004
Increase/ Increase/
Amount (Decrease) Amount (Decrease) Amount
(In millions, except percentages and per share data)
Revenues:
Company restaurant revenues ÏÏÏÏÏÏÏÏÏÏÏÏ $1,516 8% $1,407 10% $1,276
Franchise revenuesÏÏÏÏÏÏÏÏÏÏÏÏÏÏÏÏÏÏÏÏÏ 420 2% 413 14% 361
Property revenuesÏÏÏÏÏÏÏÏÏÏÏÏÏÏÏÏÏÏÏÏÏÏ 112 (7)% 120 3% 117
Total revenues ÏÏÏÏÏÏÏÏÏÏÏÏÏÏÏÏÏÏÏÏÏÏ 2,048 6% 1,940 11% 1,754
Company restaurant expensesÏÏÏÏÏÏÏÏÏÏÏÏÏÏ 1,296 8% 1,195 10% 1,087
Selling, general and administrative expensesÏÏ 488 * 487 3% 474
Property expensesÏÏÏÏÏÏÏÏÏÏÏÏÏÏÏÏÏÏÏÏÏÏÏÏ 57 (11)% 64 10% 58
Fees paid to affiliatesÏÏÏÏÏÏÏÏÏÏÏÏÏÏÏÏÏÏÏÏÏ 39 333% 9 13% 8
Other operating (income) expenses, net ÏÏÏÏÏ (2) (106)% 34 (37)% 54
Total operating costs and expenses ÏÏÏÏÏÏÏ 1,878 5% 1,789 6% 1,681
Income from operationsÏÏÏÏÏÏÏÏÏÏÏÏÏÏÏÏÏÏÏ 170 13% 151 107% 73
Interest expense, net ÏÏÏÏÏÏÏÏÏÏÏÏÏÏÏÏÏÏÏ 72 (1)% 73 14% 64
Loss on early extinguishment of debt ÏÏÏÏÏ 18 * Ì * Ì
Income before income taxes ÏÏÏÏÏÏÏÏÏÏÏÏÏÏÏ 80 3% 78 * 9
Income tax expense ÏÏÏÏÏÏÏÏÏÏÏÏÏÏÏÏÏÏÏÏ 53 71% 31 * 4
Net income ÏÏÏÏÏÏÏÏÏÏÏÏÏÏÏÏÏÏÏÏÏÏÏÏÏÏÏÏÏ $ 27 (43)% $ 47 * $ 5
Earnings per common share Ì diluted ÏÏÏÏ $ 0.24 (45)% $ 0.44 780% $ 0.05
* Not meaningful.
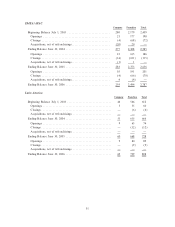
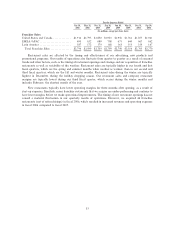
Revenues
Company restaurant revenues increased 8% to $1,516 million in fiscal 2006, primarily as a result of nine
new restaurant openings (net of closures), the acquisition of 44 franchise restaurants (net of refranchisings),
and positive comparable sales in the United States and Canada. Partially offsetting these factors were negative
comparable sales in EMEA/APAC. In fiscal 2005, company restaurant revenues increased 10% to
$1,407 million, as a result of strong comparable sales in the United States and Canada and Latin America,
where approximately 76% of our company restaurants were located.
In the United States and Canada, company restaurant revenues increased 12% to $1,032 million in fiscal
2006, primarily as a result of positive comparable sales and the acquisition of 40 franchise restaurants (net of
refranchisings), most of which were located in the United States. In fiscal 2005 company restaurant revenues
increased 15% to $923 million, primarily as a result of strong comparable sales generated from the
implementation of strategic initiatives related to our menu, advertising and operational excellence programs,
as well as the acquisition of 99 franchise restaurants.
In EMEA/APAC, company restaurant revenues decreased 2% to $428 million in fiscal 2006, primarily as
a result of negative comparable sales in the United Kingdom and Germany, where 77% of our EMEA/APAC
company restaurants were located at June 30, 2006, and the negative impact of foreign currency exchange
rates, which were partially offset by strong performance in Spain and the Netherlands. Company restaurant
revenues were negatively impacted $19 million by movement in foreign currency exchange rates. However,
this negative impact did not have a material impact on operating income as it was offset by the positive impact
to Company restaurant expenses and selling, general and administrative expenses. In fiscal 2005, company
restaurant revenues increased 1% to $435 million, primarily as a result of new restaurant openings and positive
comparable sales.
45