Burger King 2006 Annual Report Download - page 42
Download and view the complete annual report
Please find page 42 of the 2006 Burger King annual report below. You can navigate through the pages in the report by either clicking on the pages listed below, or by using the keyword search tool below to find specific information within the annual report.-
 1
1 -
2
-
3
-
4
-
5
-
6
-
7
-
8
-
9
-
10
-
11
-
12
-
13
-
14
-
15
-
16
-
17
-
18
-
19
-
20
-
21
-
22
-
23
-
24
-
25
-
26
-
27
-
28
-
29
-
30
-
31
-
 32
32 -
 33
33 -
 34
34 -
 35
35 -
 36
36 -
 37
37 -
 38
38 -
 39
39 -
 40
40 -
 41
41 -
 42
42 -
 43
43 -
 44
44 -
 45
45 -
 46
46 -
 47
47 -
 48
48 -
 49
49 -
 50
50 -
 51
51 -
 52
52 -
53
-
54
-
55
-
56
-
57
-
58
-
59
-
60
-
61
-
62
-
63
-
64
-
65
-
66
-
67
-
68
-
69
-
70
-
71
-
72
-
73
-
74
-
75
-
76
-
77
-
78
-
79
-
80
-
81
-
82
-
83
-
84
-
85
-
86
-
87
-
88
-
89
-
90
-
91
-
92
-
93
-
94
-
95
-
96
-
97
-
98
-
99
-
100
-
101
-
102
-
103
-
104
-
105
-
106
-
107
-
108
-
109
-
110
-
111
-
112
-
113
-
114
-
115
-
116
-
117
-
118
-
119
-
120
-
121
-
122
-
123
-
124
-
125
-
126
-
127
-
128
-
129
-
130
-
131
 |
 |

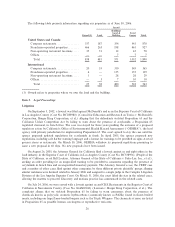
Burger King
Burger King Holdings, Inc. Holdings, Inc. and
and Subsidiaries Subsidiaries Predecessor
Combined For the For the
For the Twelve Period from Period from For the
Fiscal Years Months December 13, July 1, 2002 Fiscal Year
Ended June 30, Ended June 30, 2002 to June 30, to December 12, Ended June 30,
2006 2005 2004 2003 2003 2002 2002
(In millions, except per share data)
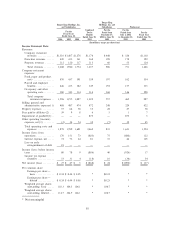
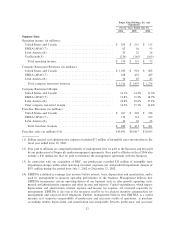
Income Statement Data:
Revenues:
Company restaurant
revenues ÏÏÏÏÏÏÏÏÏÏÏÏÏ $1,516 $1,407 $1,276 $1,174 $ 648 $ 526 $1,130
Franchise revenues ÏÏÏÏÏÏ 420 413 361 368 198 170 392
Property revenues ÏÏÏÏÏÏÏ 112 120 117 115 60 55 124
Total revenues ÏÏÏÏÏÏÏÏ 2,048 1,940 1,754 1,657 906 751 1,646
Company restaurant
expenses:
Food, paper and product
costs ÏÏÏÏÏÏÏÏÏÏÏÏÏÏÏÏ 470 437 391 359 197 162 354
Payroll and employee
benefits ÏÏÏÏÏÏÏÏÏÏÏÏÏÏ 446 415 382 349 192 157 335
Occupancy and other
operating costs ÏÏÏÏÏÏÏÏ 380 343 314 314 168 146 298
Total company
restaurant expenses ÏÏ 1,296 1,195 1,087 1,022 557 465 987
Selling, general and
administrative expenses(1) 488 487 474 472 248 224 422
Property expenses ÏÏÏÏÏÏÏÏÏ 57 64 58 55 28 27 58
Fees paid to affiliates(2) ÏÏÏ 39 9 8 6 5 1 7
Impairment of goodwill(3)ÏÏ Ì Ì Ì 875 Ì 875 5
Other operating (income)
expenses, net(3) ÏÏÏÏÏÏÏÏ (2) 34 54 32 (7) 39 45
Total operating costs and
expenses ÏÏÏÏÏÏÏÏÏÏÏÏÏ 1,878 1,789 1,681 2,462 831 1,631 1,524
Income (loss) from
operations ÏÏÏÏÏÏÏÏÏÏÏÏÏÏ 170 151 73 (805) 75 (880) 122
Interest expense, net ÏÏÏÏÏ 72 73 64 81 35 46 105
Loss on early
extinguishment of debt 18 Ì Ì Ì Ì Ì Ì
Income (loss) before income
taxes ÏÏÏÏÏÏÏÏÏÏÏÏÏÏÏÏÏÏ 80 78 9 (886) 40 (926) 17
Income tax expense
(benefit) ÏÏÏÏÏÏÏÏÏÏÏÏÏ 53 31 4 (18) 16 (34) 54
Net income (loss) ÏÏÏÏÏÏÏÏÏ $ 27 $ 47 $ 5 $ (868) $ 24 $ (892) $ (37)
Per common share:
Earnings per share Ì
basic ÏÏÏÏÏÏÏÏÏÏÏÏÏÏ $ 0.24 $ 0.44 $ 0.05 * $0.23 * *
Earnings per share Ì
dilutedÏÏÏÏÏÏÏÏÏÏÏÏÏ $ 0.24 $ 0.44 $ 0.05 * $0.23 * *
Weighted average shares
outstanding, basic ÏÏÏÏÏ 110.3 106.5 106.1 * 104.7 * *
Weighted average shares
outstanding, diluted ÏÏÏÏ 114.7 106.9 106.1 * 104.7 * *
* Not meaningful
30