Burger King 2006 Annual Report Download - page 53
Download and view the complete annual report
Please find page 53 of the 2006 Burger King annual report below. You can navigate through the pages in the report by either clicking on the pages listed below, or by using the keyword search tool below to find specific information within the annual report.-
 1
1 -
2
-
3
-
4
-
5
-
6
-
7
-
8
-
9
-
10
-
11
-
12
-
13
-
14
-
15
-
16
-
17
-
18
-
19
-
20
-
21
-
22
-
23
-
24
-
25
-
26
-
27
-
28
-
29
-
30
-
31
-
32
-
33
-
34
-
35
-
36
-
37
-
38
-
39
-
40
-
41
-
42
-
 43
43 -
 44
44 -
 45
45 -
 46
46 -
 47
47 -
 48
48 -
 49
49 -
 50
50 -
 51
51 -
 52
52 -
 53
53 -
 54
54 -
 55
55 -
 56
56 -
 57
57 -
 58
58 -
 59
59 -
 60
60 -
 61
61 -
 62
62 -
 63
63 -
64
-
65
-
66
-
67
-
68
-
69
-
70
-
71
-
72
-
73
-
74
-
75
-
76
-
77
-
78
-
79
-
80
-
81
-
82
-
83
-
84
-
85
-
86
-
87
-
88
-
89
-
90
-
91
-
92
-
93
-
94
-
95
-
96
-
97
-
98
-
99
-
100
-
101
-
102
-
103
-
104
-
105
-
106
-
107
-
108
-
109
-
110
-
111
-
112
-
113
-
114
-
115
-
116
-
117
-
118
-
119
-
120
-
121
-
122
-
123
-
124
-
125
-
126
-
127
-
128
-
129
-
130
-
131
 |
 |

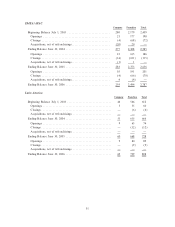
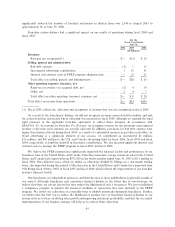
primarily by our strategic initiatives related to operational excellence, advertising and our menu. Additionally,
we and our franchisees closed 1,638 restaurants between July 1, 2002 and June 30, 2006. Approximately 73%
of these closures were franchise restaurants in the United States, which had average restaurant sales of
approximately $625,000 in the 12 months prior to closure. We and our franchisees also opened 146 new
restaurants in the United States between fiscal 2004 and fiscal 2006, of which 81 were opened for at least
12 months as of June 30, 2006. The average restaurant sales of these new restaurants was approximately
$1.3 million for the first 12 months after opening. We expect that closures of under-performing restaurants,
combined with continued improvements to average restaurant sales of existing restaurants and strong sales at
new restaurants, to result in financially stronger operators throughout our franchise base.
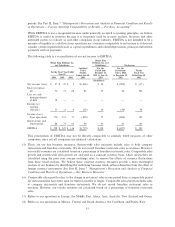
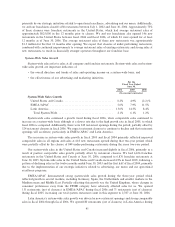
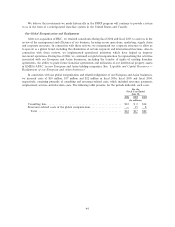
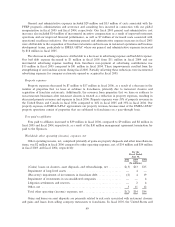
System-Wide Sales Growth
System-wide sales refer to sales at all company and franchise restaurants. System-wide sales and system-
wide sales growth are important indicators of:
‚ the overall direction and trends of sales and operating income on a system-wide basis; and
‚ the effectiveness of our advertising and marketing initiatives.
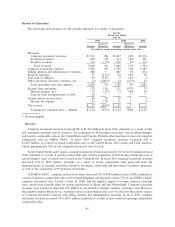
For the
Fiscal Year Ended
June 30,
2006 2005 2004
(In constant currencies)
System-Wide Sales Growth:
United States and Canada ÏÏÏÏÏÏÏÏÏÏÏÏÏÏÏÏÏÏÏÏÏÏÏÏÏÏÏÏÏÏÏÏÏÏÏ 0.2% 4.9% (2.2)%
EMEA/APAC ÏÏÏÏÏÏÏÏÏÏÏÏÏÏÏÏÏÏÏÏÏÏÏÏÏÏÏÏÏÏÏÏÏÏÏÏÏÏÏÏÏÏÏÏ 5.0% 7.9% 11.5%
Latin America ÏÏÏÏÏÏÏÏÏÏÏÏÏÏÏÏÏÏÏÏÏÏÏÏÏÏÏÏÏÏÏÏÏÏÏÏÏÏÏÏÏÏÏÏÏ 13.0% 14.5% 8.4%
Total System-WideÏÏÏÏÏÏÏÏÏÏÏÏÏÏÏÏÏÏÏÏÏÏÏÏÏÏÏÏÏÏÏÏÏÏÏÏÏÏÏ 2.1% 6.1% 1.2%
System-wide sales continued a growth trend during fiscal 2006, when comparable sales continued to
increase on a system-wide basis although at a slower rate due to the high growth rate in fiscal 2005, to which
fiscal 2006 is compared. Additionally, there were 349 restaurant openings during the period, partially offset by
324 restaurant closures in fiscal 2006. We expect restaurant closures to continue to decline and that restaurant
openings will accelerate, particularly in EMEA/APAC and Latin America.
The increases in system-wide sales growth in fiscal 2005 and fiscal 2004 primarily reflected improved
comparable sales in all regions and sales at 618 new restaurants opened during that two-year period, which
were partially offset by the closure of 849 under-performing restaurants during the same two-year period.
Our system-wide sales in the United States and Canada increased slightly in fiscal 2006, primarily as a
result of positive comparable sales growth partially offset by restaurant closures. We had 6,656 franchise
restaurants in the United States and Canada at June 30, 2006, compared to 6,876 franchise restaurants at
June 30, 2005. System-wide sales in the United States and Canada increased 4.9% in fiscal 2005, following a
pattern of declining sales in the twelve months ended June 30, 2003 and the first half of fiscal 2004, primarily
due to the implementation of our strategic initiatives related to advertising, our menu and our operational
excellence programs.
EMEA/APAC demonstrated strong system-wide sales growth during the three-year period which
reflected growth in several markets, including Germany, Spain, the Netherlands and smaller markets in the
Mediterranean and Middle East. Partially offsetting this growth was the United Kingdom, where changes in
consumer preferences away from the FFHR category have adversely affected sales for us. We opened
131 restaurants (net of closures) in EMEA/APAC during fiscal 2006 and 71 restaurants (net of closures)
during fiscal 2005, increasing our total system restaurant count in this segment to 2,787 at June 30, 2006.
Latin America's system-wide sales growth was driven by new restaurant openings and strong comparable
sales in fiscal 2004 through fiscal 2006. We opened 80 restaurants (net of closures) in Latin America during
41