Audi 2010 Annual Report Download - page 241
Download and view the complete annual report
Please find page 241 of the 2010 Audi annual report below. You can navigate through the pages in the report by either clicking on the pages listed below, or by using the keyword search tool below to find specific information within the annual report.-
 1
1 -
2
-
3
-
4
-
5
-
6
-
7
-
8
-
9
-
10
-
11
-
12
-
13
-
14
-
15
-
16
-
17
-
18
-
19
-
20
-
21
-
22
-
23
-
24
-
25
-
26
-
27
-
28
-
29
-
30
-
31
-
32
-
33
-
34
-
35
-
36
-
37
-
38
-
39
-
40
-
41
-
42
-
43
-
44
-
45
-
46
-
47
-
48
-
49
-
50
-
51
-
52
-
53
-
54
-
55
-
56
-
57
-
58
-
59
-
60
-
61
-
62
-
63
-
64
-
65
-
66
-
67
-
68
-
69
-
70
-
71
-
72
-
73
-
74
-
75
-
76
-
77
-
78
-
79
-
80
-
81
-
82
-
83
-
84
-
85
-
86
-
87
-
88
-
89
-
90
-
91
-
92
-
93
-
94
-
95
-
96
-
97
-
98
-
99
-
100
-
101
-
102
-
103
-
104
-
105
-
106
-
107
-
108
-
109
-
110
-
111
-
112
-
113
-
114
-
115
-
116
-
117
-
118
-
119
-
120
-
121
-
122
-
123
-
124
-
125
-
126
-
127
-
128
-
129
-
130
-
131
-
132
-
133
-
134
-
135
-
136
-
137
-
138
-
139
-
140
-
141
-
142
-
143
-
144
-
145
-
146
-
147
-
148
-
149
-
150
-
151
-
152
-
153
-
154
-
155
-
156
-
157
-
158
-
159
-
160
-
161
-
162
-
163
-
164
-
165
-
166
-
167
-
168
-
169
-
170
-
171
-
172
-
173
-
174
-
175
-
176
-
177
-
178
-
179
-
180
-
181
-
182
-
183
-
184
-
185
-
186
-
187
-
188
-
189
-
190
-
191
-
192
-
193
-
194
-
195
-
196
-
197
-
198
-
199
-
200
-
201
-
202
-
203
-
204
-
205
-
206
-
207
-
208
-
209
-
210
-
211
-
212
-
213
-
214
-
215
-
216
-
217
-
218
-
219
-
220
-
221
-
222
-
223
-
224
-
225
-
226
-
227
-
228
-
229
-
230
-
 231
231 -
 232
232 -
 233
233 -
 234
234 -
 235
235 -
 236
236 -
 237
237 -
 238
238 -
 239
239 -
 240
240 -
 241
241 -
 242
242 -
 243
243 -
 244
244 -
 245
245 -
 246
246 -
 247
247 -
 248
248 -
 249
249 -
 250
250 -
 251
251 -
252
-
253
-
254
-
255
-
256
-
257
-
258
-
259
-
260
-
261
-
262
-
263
 |
 |
239
Consolidated Financial
Statements
184 Income Statement
185 Statement of Recognized
Income and Expense
186 Balance Sheet
187 Cash Flow Statement
188 Statement of Changes in Equity
Notes to the Consolidated
Financial Statements
190 Development of fixed assets
in the 2010 fiscal year
192 Development of fixed assets
in the 2009 fiscal year
194 General information
200 Recognition and
measurement principles
207 Notes to the Income Statement
214 Notes to the Balance Sheet
223 Additional disclosures
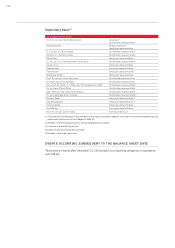
242 Events occurring subsequent
to the balance sheet date
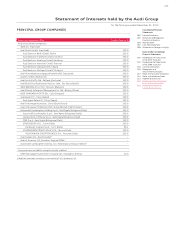
243 Statement of Interests
held by the Audi Group
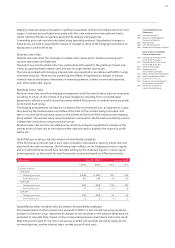
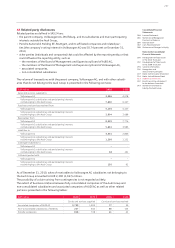
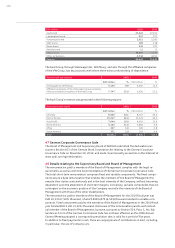
The Audi Group focuses its economic activities on automotive business. As a result, both internal
reporting and the voting, management and decision-making processes at the level of the full
Board of Management are geared toward the Audi Group as a corporate unit in the sense of a
single-segment structure focused on the automotive business. There is therefore no further
segmentation of the Group as defined in IFRS 8.
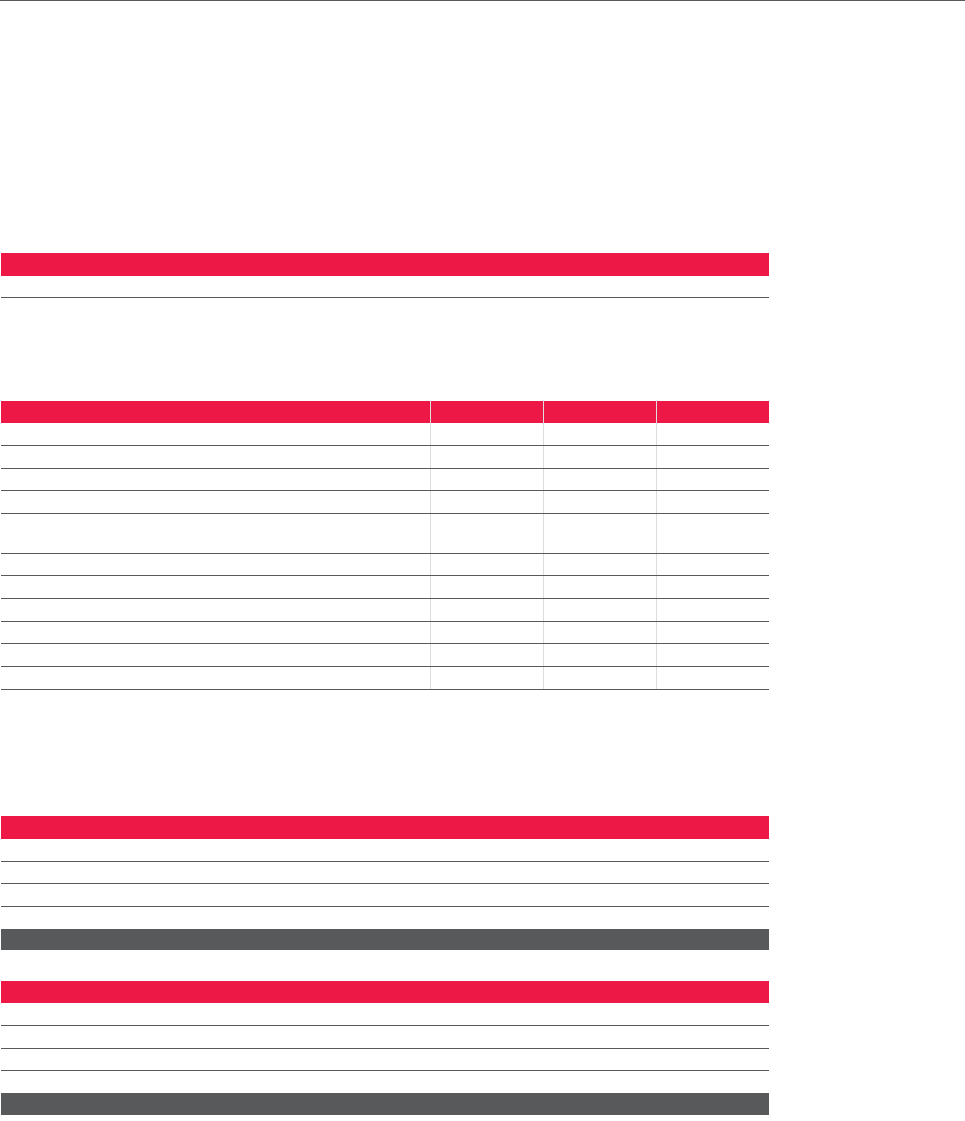
The central performance and management key figure for the Audi Group is its “operating profit.”
Internal reporting corresponds to external IFRS reporting.
EUR million 2010 2009
Operating profit 3,340 1,604
The full Board of Management regularly monitors, among others, the following financial and
economic key figures (also on a Group basis):
2010 2009
Profit before tax EUR million 3,634 1,928
Deliveries to customers – Audi brand Vehicles 1,092,411 949,729
Audi brand sales Vehicles 1,124,295 954,802
Audi brand production Vehicles 1,148,791 931,007
Investments in property, plant and equipment and intangible
assets (without development work) EUR million 1,449 1,266
Capex ratio 1) % 4.1 4.2
Inventories (including current leased assets) EUR million 3,354 2,568
Net liquidity EUR million 13,383 10,665
Workforce at Dec. 31 60,395 58,046
Return on investment %24.7 11.5
Capital turnover 2) 3.7 3.1
1) Capex ratio = Investments in property, plant and equipment and intangible assets (without development work)/revenue
2) Capital turnover = Revenue/average invested assets
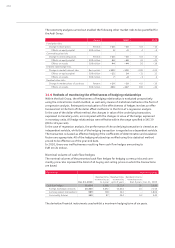
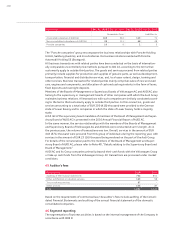
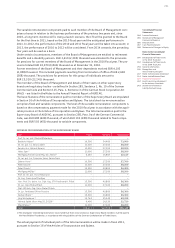
Investment and depreciation and amortization developed as follows:
EUR million 2010 2009
Investments in property, plant and equipment and intangible assets 1,449 1,266
Additions of capitalized development work 630 528
Long-term investments 67 42
Investments in leased assets –8
Total 2,146 1,844
EUR million 2010 2009
Impairment losses on property, plant and equipment and intangible assets 1,542 1,285
Amortization of capitalized development work 626 480
Impairment losses on long-term investments 19
Depreciation of leased assets 11
Total 2,170 1,775
During the 2010 fiscal year, write-ups of capitalized development costs totaled EUR 58 million.
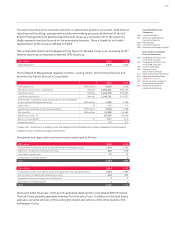
The Audi Group primarily generates revenues from the sale of cars. In addition to the Audi brand,
sales also comprise vehicles of the Lamborghini brand and vehicles of the other brands in the
Volkswagen Group.