Audi 2010 Annual Report Download - page 167
Download and view the complete annual report
Please find page 167 of the 2010 Audi annual report below. You can navigate through the pages in the report by either clicking on the pages listed below, or by using the keyword search tool below to find specific information within the annual report.-
 1
1 -
2
-
3
-
4
-
5
-
6
-
7
-
8
-
9
-
10
-
11
-
12
-
13
-
14
-
15
-
16
-
17
-
18
-
19
-
20
-
21
-
22
-
23
-
24
-
25
-
26
-
27
-
28
-
29
-
30
-
31
-
32
-
33
-
34
-
35
-
36
-
37
-
38
-
39
-
40
-
41
-
42
-
43
-
44
-
45
-
46
-
47
-
48
-
49
-
50
-
51
-
52
-
53
-
54
-
55
-
56
-
57
-
58
-
59
-
60
-
61
-
62
-
63
-
64
-
65
-
66
-
67
-
68
-
69
-
70
-
71
-
72
-
73
-
74
-
75
-
76
-
77
-
78
-
79
-
80
-
81
-
82
-
83
-
84
-
85
-
86
-
87
-
88
-
89
-
90
-
91
-
92
-
93
-
94
-
95
-
96
-
97
-
98
-
99
-
100
-
101
-
102
-
103
-
104
-
105
-
106
-
107
-
108
-
109
-
110
-
111
-
112
-
113
-
114
-
115
-
116
-
117
-
118
-
119
-
120
-
121
-
122
-
123
-
124
-
125
-
126
-
127
-
128
-
129
-
130
-
131
-
132
-
133
-
134
-
135
-
136
-
137
-
138
-
139
-
140
-
141
-
142
-
143
-
144
-
145
-
146
-
147
-
148
-
149
-
150
-
151
-
152
-
153
-
154
-
155
-
156
-
 157
157 -
 158
158 -
 159
159 -
 160
160 -
 161
161 -
 162
162 -
 163
163 -
 164
164 -
 165
165 -
 166
166 -
 167
167 -
 168
168 -
 169
169 -
 170
170 -
 171
171 -
 172
172 -
 173
173 -
 174
174 -
 175
175 -
 176
176 -
 177
177 -
178
-
179
-
180
-
181
-
182
-
183
-
184
-
185
-
186
-
187
-
188
-
189
-
190
-
191
-
192
-
193
-
194
-
195
-
196
-
197
-
198
-
199
-
200
-
201
-
202
-
203
-
204
-
205
-
206
-
207
-
208
-
209
-
210
-
211
-
212
-
213
-
214
-
215
-
216
-
217
-
218
-
219
-
220
-
221
-
222
-
223
-
224
-
225
-
226
-
227
-
228
-
229
-
230
-
231
-
232
-
233
-
234
-
235
-
236
-
237
-
238
-
239
-
240
-
241
-
242
-
243
-
244
-
245
-
246
-
247
-
248
-
249
-
250
-
251
-
252
-
253
-
254
-
255
-
256
-
257
-
258
-
259
-
260
-
261
-
262
-
263
 |
 |

165
Management Report
132 Audi Group
141 Business and underlying
situation
156 Financial performance
indicators
159 Social and ecological aspects
159 Employees
162 Audi in society
163 Location-based
environmental aspects
167 Product-based
environmental aspects
173 Risks, opportunities
and outlook
183 Disclaimer
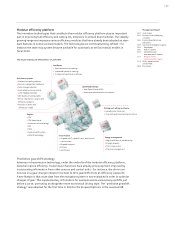
conventional tool. The adoption of innovative joining techniques in body manufacturing, such as
spot welding, laser welding and bonding techniques, also cuts consumption of operating mate-
rials and energy. Technical solutions such as a modern combined heat, power and refrigeration
plant at Ingolstadt as well as heat recovery systems and the use of district heating have further-
more proved very successful for the Audi Group. The district heating contract for the Ingolstadt
plant concluded in 2009 means that the amount of waste heat from neighboring industrial
enterprises being used will continue to rise in the future.
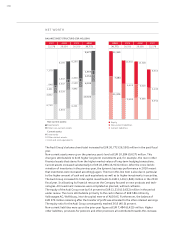
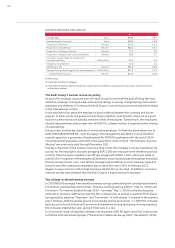
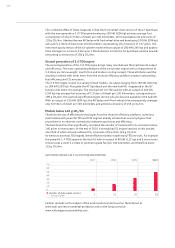
DEVELOPMENT IN OVERALL ENERGY CONSUMPTION, VEHICLE AND ENGINE PRODUCTION BY THE AUDI GROUP 1)
Vehicle production
(thousand units)
Engine production
(thousand units)
1,102
1,648
2,407
Total energy consumption
(GWh)
800
400
0
2010200920082007
2,400
2,000
1,600
1,200
2,800
867
1,916
2,193
953
1,902
2,337
902
1,384
2,157
1) Ingolstadt, Neckarsulm, Brussels (from 2008; excluding Volkswagen Polo), Győr and Sant’Agata Bolognese plants;
2010 figures provisional
The slight rise in overall energy consumption and CO₂ emissions is mainly attributable to the
increased production volume. The pattern of recent years demonstrates that total energy
consumption has nevertheless been kept virtually stable.
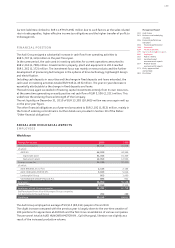
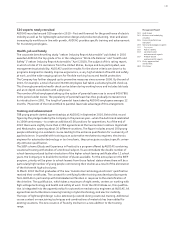
The other key environmental figures that the Audi Group observes over and above energy
consumption also reflect the increased production volume.
ENVIRONMENTAL STRUCTURAL DATA 1)
2010 2009
VOC emissions 2) t 1,945 1,750
Direct CO2 emissions 3) t 206,370 188,339
Volume of waste water m³ 2,080,582 1,708,808
Fresh water purchased m³ 2,991,498 2,702,821
Total volume of waste t57,103 51,896
of which recyclable waste t48,970 42,624
of which disposable waste t8,133 9,272
Metallic waste (scrap) t306,533 282,517
1) Ingolstadt, Neckarsulm, Brussels (excluding Volkswagen Polo), Győr and Sant’Agata Bolognese plants;
2010 figures provisional
2) VOC emissions (volatile organic compounds): This figure comprises emissions from the paint shops, test rigs and other
facilities. From 2010 new calculation basis for the Ingolstadt plant to comply with new statutory requirements.
3) Direct CO₂ emissions: This figure is made up of CO₂ emissions generated by the use of fuel at the plant, and CO₂ emissions
produced by the operation of test rigs.