Audi 2010 Annual Report Download - page 228
Download and view the complete annual report
Please find page 228 of the 2010 Audi annual report below. You can navigate through the pages in the report by either clicking on the pages listed below, or by using the keyword search tool below to find specific information within the annual report.-
 1
1 -
2
-
3
-
4
-
5
-
6
-
7
-
8
-
9
-
10
-
11
-
12
-
13
-
14
-
15
-
16
-
17
-
18
-
19
-
20
-
21
-
22
-
23
-
24
-
25
-
26
-
27
-
28
-
29
-
30
-
31
-
32
-
33
-
34
-
35
-
36
-
37
-
38
-
39
-
40
-
41
-
42
-
43
-
44
-
45
-
46
-
47
-
48
-
49
-
50
-
51
-
52
-
53
-
54
-
55
-
56
-
57
-
58
-
59
-
60
-
61
-
62
-
63
-
64
-
65
-
66
-
67
-
68
-
69
-
70
-
71
-
72
-
73
-
74
-
75
-
76
-
77
-
78
-
79
-
80
-
81
-
82
-
83
-
84
-
85
-
86
-
87
-
88
-
89
-
90
-
91
-
92
-
93
-
94
-
95
-
96
-
97
-
98
-
99
-
100
-
101
-
102
-
103
-
104
-
105
-
106
-
107
-
108
-
109
-
110
-
111
-
112
-
113
-
114
-
115
-
116
-
117
-
118
-
119
-
120
-
121
-
122
-
123
-
124
-
125
-
126
-
127
-
128
-
129
-
130
-
131
-
132
-
133
-
134
-
135
-
136
-
137
-
138
-
139
-
140
-
141
-
142
-
143
-
144
-
145
-
146
-
147
-
148
-
149
-
150
-
151
-
152
-
153
-
154
-
155
-
156
-
157
-
158
-
159
-
160
-
161
-
162
-
163
-
164
-
165
-
166
-
167
-
168
-
169
-
170
-
171
-
172
-
173
-
174
-
175
-
176
-
177
-
178
-
179
-
180
-
181
-
182
-
183
-
184
-
185
-
186
-
187
-
188
-
189
-
190
-
191
-
192
-
193
-
194
-
195
-
196
-
197
-
198
-
199
-
200
-
201
-
202
-
203
-
204
-
205
-
206
-
207
-
208
-
209
-
210
-
211
-
212
-
213
-
214
-
215
-
216
-
217
-
 218
218 -
 219
219 -
 220
220 -
 221
221 -
 222
222 -
 223
223 -
 224
224 -
 225
225 -
 226
226 -
 227
227 -
 228
228 -
 229
229 -
 230
230 -
 231
231 -
 232
232 -
 233
233 -
 234
234 -
 235
235 -
 236
236 -
 237
237 -
 238
238 -
239
-
240
-
241
-
242
-
243
-
244
-
245
-
246
-
247
-
248
-
249
-
250
-
251
-
252
-
253
-
254
-
255
-
256
-
257
-
258
-
259
-
260
-
261
-
262
-
263
 |
 |

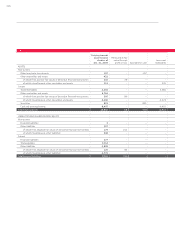
226
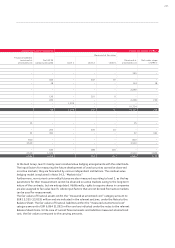
EUR million
Carrying amount
as per balance
sheet as of
Dec. 31, 2009
Measured at fair
value through
profit or loss Available for sale Loans and
receivables
ASSETS
Non-current
Other long-term investments 107 – 107 –
Other receivables and assets 422
of which from positive fair values of derivative financial instruments 310 29 – –
of which miscellaneous other receivables and assets 111 – –105
Current
Trade receivables 2,281 – –2,281
Other receivables and assets 4,764
of which from positive fair values of derivative financial instruments 505 89 – –
of which miscellaneous other receivables and assets 4,260 – –4,073
Securities 821 – 821 –
Cash and cash equivalents 6,455 – –6,455
Total financial assets 14,850 118 928 12,914
LIABILITIES AND SHAREHOLDERS’ EQUITY
Non-current
Financial liabilities 2– – –
Other liabilities 527
of which from negative fair values of derivative financial instruments 179 151 – –
of which miscellaneous other liabilities 348 – – –
Current
Financial liabilities 577 – – –
Trade payables 3,114 – – –
Other liabilities 2,895
of which from negative fair values of derivative financial instruments 120 85 – –
of which miscellaneous other liabilities 2,776 – – –
Total financial liabilities 7,115 236 – –