Audi 2010 Annual Report Download - page 160
Download and view the complete annual report
Please find page 160 of the 2010 Audi annual report below. You can navigate through the pages in the report by either clicking on the pages listed below, or by using the keyword search tool below to find specific information within the annual report.-
 1
1 -
2
-
3
-
4
-
5
-
6
-
7
-
8
-
9
-
10
-
11
-
12
-
13
-
14
-
15
-
16
-
17
-
18
-
19
-
20
-
21
-
22
-
23
-
24
-
25
-
26
-
27
-
28
-
29
-
30
-
31
-
32
-
33
-
34
-
35
-
36
-
37
-
38
-
39
-
40
-
41
-
42
-
43
-
44
-
45
-
46
-
47
-
48
-
49
-
50
-
51
-
52
-
53
-
54
-
55
-
56
-
57
-
58
-
59
-
60
-
61
-
62
-
63
-
64
-
65
-
66
-
67
-
68
-
69
-
70
-
71
-
72
-
73
-
74
-
75
-
76
-
77
-
78
-
79
-
80
-
81
-
82
-
83
-
84
-
85
-
86
-
87
-
88
-
89
-
90
-
91
-
92
-
93
-
94
-
95
-
96
-
97
-
98
-
99
-
100
-
101
-
102
-
103
-
104
-
105
-
106
-
107
-
108
-
109
-
110
-
111
-
112
-
113
-
114
-
115
-
116
-
117
-
118
-
119
-
120
-
121
-
122
-
123
-
124
-
125
-
126
-
127
-
128
-
129
-
130
-
131
-
132
-
133
-
134
-
135
-
136
-
137
-
138
-
139
-
140
-
141
-
142
-
143
-
144
-
145
-
146
-
147
-
148
-
149
-
 150
150 -
 151
151 -
 152
152 -
 153
153 -
 154
154 -
 155
155 -
 156
156 -
 157
157 -
 158
158 -
 159
159 -
 160
160 -
 161
161 -
 162
162 -
 163
163 -
 164
164 -
 165
165 -
 166
166 -
 167
167 -
 168
168 -
 169
169 -
 170
170 -
171
-
172
-
173
-
174
-
175
-
176
-
177
-
178
-
179
-
180
-
181
-
182
-
183
-
184
-
185
-
186
-
187
-
188
-
189
-
190
-
191
-
192
-
193
-
194
-
195
-
196
-
197
-
198
-
199
-
200
-
201
-
202
-
203
-
204
-
205
-
206
-
207
-
208
-
209
-
210
-
211
-
212
-
213
-
214
-
215
-
216
-
217
-
218
-
219
-
220
-
221
-
222
-
223
-
224
-
225
-
226
-
227
-
228
-
229
-
230
-
231
-
232
-
233
-
234
-
235
-
236
-
237
-
238
-
239
-
240
-
241
-
242
-
243
-
244
-
245
-
246
-
247
-
248
-
249
-
250
-
251
-
252
-
253
-
254
-
255
-
256
-
257
-
258
-
259
-
260
-
261
-
262
-
263
 |
 |

158
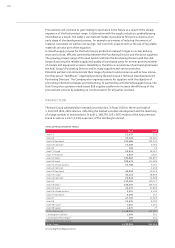
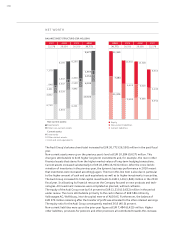
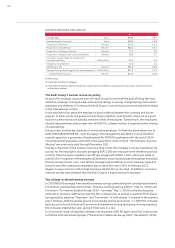
NET WORTH
BALANCE SHEET STRUCTURE (EUR MILLION)
2010200920082007 2007200820092010
30,772 26,056 22,57826,05622,578 26,550 30,772 26,550
Fixed assets
Other non-current assets
Inventories
Other current assets
Cash and cash equivalents
Equity
Non-current liabilities
Current liabilities
8,190
7,379
1,347
946 3,347
2,661 8,339
4,833
4,852
6,740
8,296
1,340
2,568
7,890
6,455
10,328
6,029
9,699
8,355
5,269
8,954
10,632
6,425
9,493
8,677
1,907
3,354
10,724
6,109
11,310
7,484
11,979
Non-current assets:
Current assets:
The Audi Group’s balance sheet total increased to EUR 30,772 (26,550) million in the past fiscal
year.
Non-current assets were up on the previous year’s level at EUR 10,584 (9,637) million. This
change is attributable to both higher long-term investments and, for example, the rise in other
financial assets that stems from the higher market values of long-term hedging transactions.
Current assets increased substantially to EUR 20,188 (16,913) million. After the crisis-led eli-
mination of inventories in the previous year, the dynamic business performance in 2010 meant
that inventories were increased accordingly again. The rise in this line item is also due in particular
to the higher amount of cash and cash equivalents as well as to higher investments in securities.
The Audi Group increased its total capital investments to EUR 2,146 (1,844) million in the 2010
fiscal year. In allocating its financial resources the Company focused on new products and tech-
nologies. All investment measures were completed as planned, without cutbacks.
The equity of the Audi Group rose by 6.4 percent to EUR 11,310 (10,632) million in the period
under review. The rise is attributable primarily to the cash infusion of EUR 586 million by
Volkswagen AG, Wolfsburg, into the capital reserve of AUDI AG. Furthermore, the balance of
EUR 576 million remaining after the transfer of profit was allocated to the other retained earnings.
The equity ratio for the Audi Group consequently reached 36.8 (40.0) percent.
Non-current liabilities were up on the prior-year figure at EUR 7,484 (6,425) million. Higher
other liabilities, provisions for pensions and other provisions all contributed towards this increase.