Audi 2010 Annual Report Download - page 236
Download and view the complete annual report
Please find page 236 of the 2010 Audi annual report below. You can navigate through the pages in the report by either clicking on the pages listed below, or by using the keyword search tool below to find specific information within the annual report.-
 1
1 -
2
-
3
-
4
-
5
-
6
-
7
-
8
-
9
-
10
-
11
-
12
-
13
-
14
-
15
-
16
-
17
-
18
-
19
-
20
-
21
-
22
-
23
-
24
-
25
-
26
-
27
-
28
-
29
-
30
-
31
-
32
-
33
-
34
-
35
-
36
-
37
-
38
-
39
-
40
-
41
-
42
-
43
-
44
-
45
-
46
-
47
-
48
-
49
-
50
-
51
-
52
-
53
-
54
-
55
-
56
-
57
-
58
-
59
-
60
-
61
-
62
-
63
-
64
-
65
-
66
-
67
-
68
-
69
-
70
-
71
-
72
-
73
-
74
-
75
-
76
-
77
-
78
-
79
-
80
-
81
-
82
-
83
-
84
-
85
-
86
-
87
-
88
-
89
-
90
-
91
-
92
-
93
-
94
-
95
-
96
-
97
-
98
-
99
-
100
-
101
-
102
-
103
-
104
-
105
-
106
-
107
-
108
-
109
-
110
-
111
-
112
-
113
-
114
-
115
-
116
-
117
-
118
-
119
-
120
-
121
-
122
-
123
-
124
-
125
-
126
-
127
-
128
-
129
-
130
-
131
-
132
-
133
-
134
-
135
-
136
-
137
-
138
-
139
-
140
-
141
-
142
-
143
-
144
-
145
-
146
-
147
-
148
-
149
-
150
-
151
-
152
-
153
-
154
-
155
-
156
-
157
-
158
-
159
-
160
-
161
-
162
-
163
-
164
-
165
-
166
-
167
-
168
-
169
-
170
-
171
-
172
-
173
-
174
-
175
-
176
-
177
-
178
-
179
-
180
-
181
-
182
-
183
-
184
-
185
-
186
-
187
-
188
-
189
-
190
-
191
-
192
-
193
-
194
-
195
-
196
-
197
-
198
-
199
-
200
-
201
-
202
-
203
-
204
-
205
-
206
-
207
-
208
-
209
-
210
-
211
-
212
-
213
-
214
-
215
-
216
-
217
-
218
-
219
-
220
-
221
-
222
-
223
-
224
-
225
-
 226
226 -
 227
227 -
 228
228 -
 229
229 -
 230
230 -
 231
231 -
 232
232 -
 233
233 -
 234
234 -
 235
235 -
 236
236 -
 237
237 -
 238
238 -
 239
239 -
 240
240 -
 241
241 -
 242
242 -
 243
243 -
 244
244 -
 245
245 -
 246
246 -
247
-
248
-
249
-
250
-
251
-
252
-
253
-
254
-
255
-
256
-
257
-
258
-
259
-
260
-
261
-
262
-
263
 |
 |

234
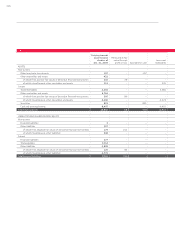
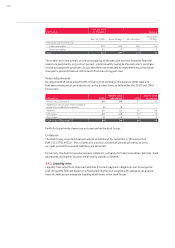
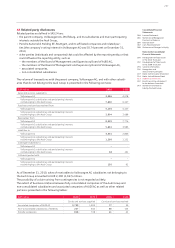
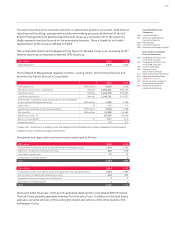
The sensitivity analyses carried out enabled the following other market risks to be quantified for
the Audi Group:
Data in 2010 2009
Fund price risks
Change in share prices Percent + 10 – 10 + 10 – 10
Effects on equity capital EUR million 8 – 9 4 – 4
Commodity price risks
Change in commodity prices Percent + 10 – 10 + 10 – 10
Effects on equity capital EUR million 46 – 46 41 – 41
Effects on results EUR million 44 – 44 16 – 16
Interest rate change risks
Change in market interest rate Basis points + 100 – 100 + 100 – 100
Effects on equity capital EUR million – 12 14 – 11 12
Effects on results EUR million 7 – 8 – 3 4
Residual value risks
Change in market prices of used cars Percent + 10 – 10 + 10 – 10
Effects on results EUR million 226 – 127 200 – 46
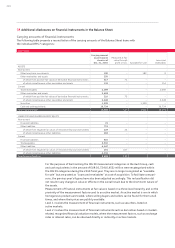
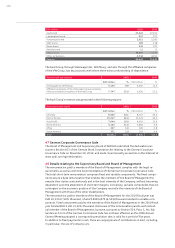
34.4 Methods of monitoring the effectiveness of hedging relationships
Within the Audi Group, the effectiveness of hedging relationships is evaluated prospectively
using the critical terms match method, as well as by means of statistical methods in the form of
a regression analysis. Retrospective evaluation of the effectiveness of hedges involves an effec-
tiveness test in the form of the dollar offset method or in the form of a regression analysis.
In the case of the dollar offset method, the changes in value of the underlying transaction,
expressed in monetary units, are compared with the changes in value of the hedge, expressed
in monetary units. All hedge relationships were effective within the range specified in IAS 39
(80 to 125 percent).
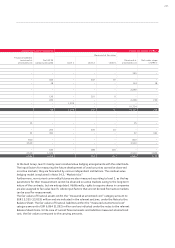
In the case of regression analysis, the performance of the underlying transaction is viewed as an
independent variable, while that of the hedging transaction is regarded as a dependent variable.
The transaction is classed as effective hedging if the coefficients of determination and escalation
factors are appropriate. All of the hedging relationships verified using this statistical method
proved to be effective as of the year-end date.
In 2010, there was ineffectiveness resulting from cash flow hedges amounting to
EUR 10 (3) million.
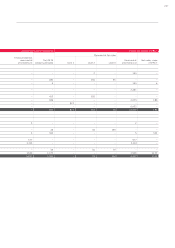
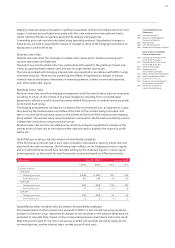
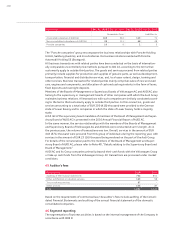
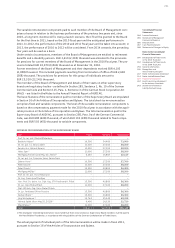
Nominal volume of cash flow hedges
The nominal volumes of the presented cash flow hedges for hedging currency risks and com-
modity price risks represent the total of all buying and selling prices on which the transactions
are based.
EUR million Nominal volumes
Dec. 31, 2010
Residual time
to maturity up
to 1 year
Residual time
to maturity
up to 5 years
Residual time to
maturity more
than 5 years Dec. 31, 2009
Cash flow hedges 21,664 6,508 15,129 28 9,289
Foreign exchange contracts 20,330 5,692 14,624 14 7,143
Currency option transactions 989 728 261 – 1,806
Commodity futures 345 87 244 14 340
The derivative financial instruments used exhibit a maximum hedging term of six years.