Audi 2010 Annual Report Download - page 231
Download and view the complete annual report
Please find page 231 of the 2010 Audi annual report below. You can navigate through the pages in the report by either clicking on the pages listed below, or by using the keyword search tool below to find specific information within the annual report.-
 1
1 -
2
-
3
-
4
-
5
-
6
-
7
-
8
-
9
-
10
-
11
-
12
-
13
-
14
-
15
-
16
-
17
-
18
-
19
-
20
-
21
-
22
-
23
-
24
-
25
-
26
-
27
-
28
-
29
-
30
-
31
-
32
-
33
-
34
-
35
-
36
-
37
-
38
-
39
-
40
-
41
-
42
-
43
-
44
-
45
-
46
-
47
-
48
-
49
-
50
-
51
-
52
-
53
-
54
-
55
-
56
-
57
-
58
-
59
-
60
-
61
-
62
-
63
-
64
-
65
-
66
-
67
-
68
-
69
-
70
-
71
-
72
-
73
-
74
-
75
-
76
-
77
-
78
-
79
-
80
-
81
-
82
-
83
-
84
-
85
-
86
-
87
-
88
-
89
-
90
-
91
-
92
-
93
-
94
-
95
-
96
-
97
-
98
-
99
-
100
-
101
-
102
-
103
-
104
-
105
-
106
-
107
-
108
-
109
-
110
-
111
-
112
-
113
-
114
-
115
-
116
-
117
-
118
-
119
-
120
-
121
-
122
-
123
-
124
-
125
-
126
-
127
-
128
-
129
-
130
-
131
-
132
-
133
-
134
-
135
-
136
-
137
-
138
-
139
-
140
-
141
-
142
-
143
-
144
-
145
-
146
-
147
-
148
-
149
-
150
-
151
-
152
-
153
-
154
-
155
-
156
-
157
-
158
-
159
-
160
-
161
-
162
-
163
-
164
-
165
-
166
-
167
-
168
-
169
-
170
-
171
-
172
-
173
-
174
-
175
-
176
-
177
-
178
-
179
-
180
-
181
-
182
-
183
-
184
-
185
-
186
-
187
-
188
-
189
-
190
-
191
-
192
-
193
-
194
-
195
-
196
-
197
-
198
-
199
-
200
-
201
-
202
-
203
-
204
-
205
-
206
-
207
-
208
-
209
-
210
-
211
-
212
-
213
-
214
-
215
-
216
-
217
-
218
-
219
-
220
-
 221
221 -
 222
222 -
 223
223 -
 224
224 -
 225
225 -
 226
226 -
 227
227 -
 228
228 -
 229
229 -
 230
230 -
 231
231 -
 232
232 -
 233
233 -
 234
234 -
 235
235 -
 236
236 -
 237
237 -
 238
238 -
 239
239 -
 240
240 -
 241
241 -
242
-
243
-
244
-
245
-
246
-
247
-
248
-
249
-
250
-
251
-
252
-
253
-
254
-
255
-
256
-
257
-
258
-
259
-
260
-
261
-
262
-
263
 |
 |

229
Consolidated Financial
Statements
184 Income Statement
185 Statement of Recognized
Income and Expense
186 Balance Sheet
187 Cash Flow Statement
188 Statement of Changes in Equity
Notes to the Consolidated
Financial Statements
190 Development of fixed assets
in the 2010 fiscal year
192 Development of fixed assets
in the 2009 fiscal year
194 General information
200 Recognition and
measurement principles
207 Notes to the Income Statement
214 Notes to the Balance Sheet
223 Additional disclosures
242 Events occurring subsequent
to the balance sheet date
243 Statement of Interests
held by the Audi Group
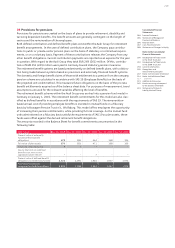
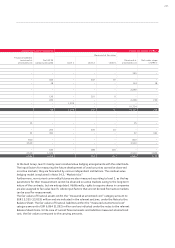
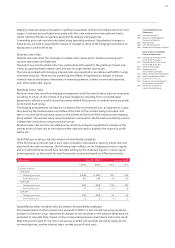
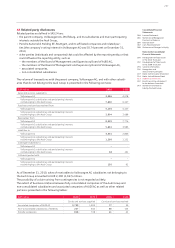
The credit quality of financial assets measured at amortized cost is shown in the following table:
EUR million
Gross carrying
amount as of
Dec. 31, 2010
Neither past
due nor
impaired Past due and
not impaired Impaired
Measured at amortized cost
Trade receivables 2,145 1,646 437 62
Other receivables 7,152 7,054 43 55
of which receivables from loans 6,897 6,891 –6
of which miscellaneous receivables 255 163 43 49
Total 9,297 8,700 480 116
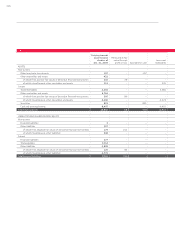
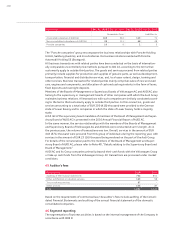
EUR million
Gross carrying
amount as of
Dec. 31, 2009
Neither past
due nor
impaired Past due and
not impaired Impaired
Measured at amortized cost
Trade receivables 2,314 1,682 573 60
Other receivables 4,243 4,132 43 68
of which receivables from loans 3,966 3,965 01
of which miscellaneous receivables 277 167 42 67
Total 6,557 5,814 615 128
The Audi Group’s trading partners, borrowers and debtors are regularly monitored under the risk
management system. All receivables that are “neither past due nor impaired,” amounting to
EUR 8,700 (5,814) million, are allocable to risk category 1. Risk category 1 is the highest rating
category within the Volkswagen Group; it exclusively comprises “receivables owing from customers
of high creditworthiness.”
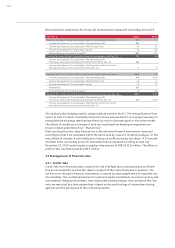
Within the Audi Group, there are absolutely no past due financial instruments measured at fair
value. The fair values of these financial instruments are determined based on their market prices.
In fiscal 2010, specific value adjustments of EUR 2 million relating to securities measured at fair
value were reversed at the Audi Group. During the prior year, individual bad debt allowances
were made for securities measured at fair value with a cost of purchase of EUR 18 million.
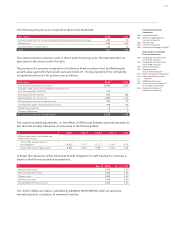
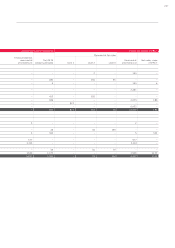
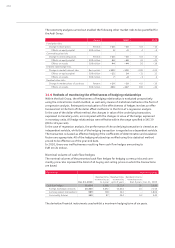
Financial assets that are past due and not impaired are presented in the following analysis by
maturity dates of gross carrying amounts:
EUR million Past due and
not impaired Past due
Dec. 31, 2010 Up to 30 days30 to 90 daysMore than
90 days
Measured at amortized cost
Trade receivables 437 310 81 46
Other receivables 43 26 14 2
Total 480 337 96 48