Audi 2010 Annual Report Download - page 226
Download and view the complete annual report
Please find page 226 of the 2010 Audi annual report below. You can navigate through the pages in the report by either clicking on the pages listed below, or by using the keyword search tool below to find specific information within the annual report.-
 1
1 -
2
-
3
-
4
-
5
-
6
-
7
-
8
-
9
-
10
-
11
-
12
-
13
-
14
-
15
-
16
-
17
-
18
-
19
-
20
-
21
-
22
-
23
-
24
-
25
-
26
-
27
-
28
-
29
-
30
-
31
-
32
-
33
-
34
-
35
-
36
-
37
-
38
-
39
-
40
-
41
-
42
-
43
-
44
-
45
-
46
-
47
-
48
-
49
-
50
-
51
-
52
-
53
-
54
-
55
-
56
-
57
-
58
-
59
-
60
-
61
-
62
-
63
-
64
-
65
-
66
-
67
-
68
-
69
-
70
-
71
-
72
-
73
-
74
-
75
-
76
-
77
-
78
-
79
-
80
-
81
-
82
-
83
-
84
-
85
-
86
-
87
-
88
-
89
-
90
-
91
-
92
-
93
-
94
-
95
-
96
-
97
-
98
-
99
-
100
-
101
-
102
-
103
-
104
-
105
-
106
-
107
-
108
-
109
-
110
-
111
-
112
-
113
-
114
-
115
-
116
-
117
-
118
-
119
-
120
-
121
-
122
-
123
-
124
-
125
-
126
-
127
-
128
-
129
-
130
-
131
-
132
-
133
-
134
-
135
-
136
-
137
-
138
-
139
-
140
-
141
-
142
-
143
-
144
-
145
-
146
-
147
-
148
-
149
-
150
-
151
-
152
-
153
-
154
-
155
-
156
-
157
-
158
-
159
-
160
-
161
-
162
-
163
-
164
-
165
-
166
-
167
-
168
-
169
-
170
-
171
-
172
-
173
-
174
-
175
-
176
-
177
-
178
-
179
-
180
-
181
-
182
-
183
-
184
-
185
-
186
-
187
-
188
-
189
-
190
-
191
-
192
-
193
-
194
-
195
-
196
-
197
-
198
-
199
-
200
-
201
-
202
-
203
-
204
-
205
-
206
-
207
-
208
-
209
-
210
-
211
-
212
-
213
-
214
-
215
-
 216
216 -
 217
217 -
 218
218 -
 219
219 -
 220
220 -
 221
221 -
 222
222 -
 223
223 -
 224
224 -
 225
225 -
 226
226 -
 227
227 -
 228
228 -
 229
229 -
 230
230 -
 231
231 -
 232
232 -
 233
233 -
 234
234 -
 235
235 -
 236
236 -
237
-
238
-
239
-
240
-
241
-
242
-
243
-
244
-
245
-
246
-
247
-
248
-
249
-
250
-
251
-
252
-
253
-
254
-
255
-
256
-
257
-
258
-
259
-
260
-
261
-
262
-
263
 |
 |

224
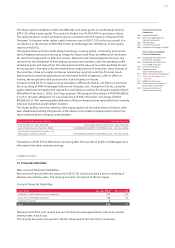
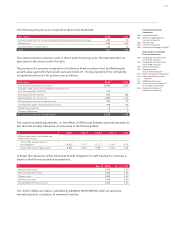
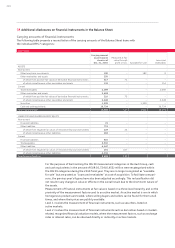
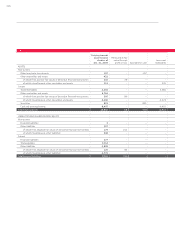
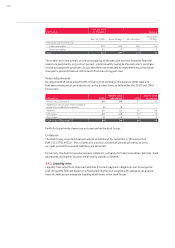
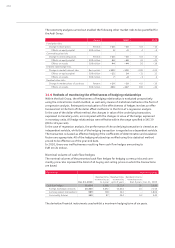
33 Additional disclosures on financial instruments in the Balance Sheet
Carrying amounts of financial instruments
The following table presents a reconciliation of the carrying amounts of the Balance Sheet items with
the individual IFRS 7 categories:
EUR million
Carrying amount
as per balance
sheet as of
Dec. 31, 2010
Measured at fair
value through
profit or loss Available for sale Loans and
receivables
ASSETS
Non-current
Other long-term investments 190 – 182 9
Other receivables and assets 550
of which from positive fair values of derivative financial instruments 417 72 – –
of which miscellaneous other receivables and assets 132 – –114
Current
Trade receivables 2,099 – –2,099
Other receivables and assets 2,658
of which from positive fair values of derivative financial instruments 210 75 – –
of which miscellaneous other receivables and assets 2,448 – –2,228
Securities 1,339 – 1,339 –
Cash and cash equivalents 10,724 – –10,724
Total financial assets 17,560 147 1,521 15,173
LIABILITIES AND SHAREHOLDERS’ EQUITY
Non-current
Financial liabilities 15 – – –
Other liabilities 712
of which from negative fair values of derivative financial instruments 229 25 – –
of which miscellaneous other liabilities 483 – – –
Current
Financial liabilities 810 – – –
Trade payables 3,510 – – –
Other liabilities 4,447
of which from negative fair values of derivative financial instruments 291 107 – –
of which miscellaneous other liabilities 4,156 – – –
Total financial liabilities 9,494 132 – –
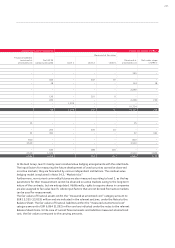
For the purposes of harmonizing the IAS 39 measurement categories in the Audi Group, cash
and cash equivalents in the amount of EUR 10,724 (6,455) million were recategorized within
the IAS 39 categories during the 2010 fiscal year. They are no longer recognized as “available
for sale” but are posted as “Loans and receivables” at cost of acquisition. To facilitate compari-
sons, the previous year’s figures have also been adjusted accordingly. This reclassification did
not result in any changes in value or effects on the overall result due to the short-term nature of
the assets.
Measurement of financial instruments at fair value is based on a three-level hierarchy and on the
proximity of the measurement factors used to an active market. An active market is one in which
homogenous products are traded, where willing buyers and sellers can be found for them at all
times, and where their prices are publicly available.
Level 1 involves the measurement of financial instruments, such as securities, listed on
active markets.
Level 2 involves the measurement of financial instruments such as derivatives based on market-
related, recognized financial valuation models, where the measurement factors, such as exchange
rates or interest rates, can be observed directly or indirectly on active markets.