Audi 2010 Annual Report Download - page 159
Download and view the complete annual report
Please find page 159 of the 2010 Audi annual report below. You can navigate through the pages in the report by either clicking on the pages listed below, or by using the keyword search tool below to find specific information within the annual report.-
 1
1 -
2
-
3
-
4
-
5
-
6
-
7
-
8
-
9
-
10
-
11
-
12
-
13
-
14
-
15
-
16
-
17
-
18
-
19
-
20
-
21
-
22
-
23
-
24
-
25
-
26
-
27
-
28
-
29
-
30
-
31
-
32
-
33
-
34
-
35
-
36
-
37
-
38
-
39
-
40
-
41
-
42
-
43
-
44
-
45
-
46
-
47
-
48
-
49
-
50
-
51
-
52
-
53
-
54
-
55
-
56
-
57
-
58
-
59
-
60
-
61
-
62
-
63
-
64
-
65
-
66
-
67
-
68
-
69
-
70
-
71
-
72
-
73
-
74
-
75
-
76
-
77
-
78
-
79
-
80
-
81
-
82
-
83
-
84
-
85
-
86
-
87
-
88
-
89
-
90
-
91
-
92
-
93
-
94
-
95
-
96
-
97
-
98
-
99
-
100
-
101
-
102
-
103
-
104
-
105
-
106
-
107
-
108
-
109
-
110
-
111
-
112
-
113
-
114
-
115
-
116
-
117
-
118
-
119
-
120
-
121
-
122
-
123
-
124
-
125
-
126
-
127
-
128
-
129
-
130
-
131
-
132
-
133
-
134
-
135
-
136
-
137
-
138
-
139
-
140
-
141
-
142
-
143
-
144
-
145
-
146
-
147
-
148
-
 149
149 -
 150
150 -
 151
151 -
 152
152 -
 153
153 -
 154
154 -
 155
155 -
 156
156 -
 157
157 -
 158
158 -
 159
159 -
 160
160 -
 161
161 -
 162
162 -
 163
163 -
 164
164 -
 165
165 -
 166
166 -
 167
167 -
 168
168 -
 169
169 -
170
-
171
-
172
-
173
-
174
-
175
-
176
-
177
-
178
-
179
-
180
-
181
-
182
-
183
-
184
-
185
-
186
-
187
-
188
-
189
-
190
-
191
-
192
-
193
-
194
-
195
-
196
-
197
-
198
-
199
-
200
-
201
-
202
-
203
-
204
-
205
-
206
-
207
-
208
-
209
-
210
-
211
-
212
-
213
-
214
-
215
-
216
-
217
-
218
-
219
-
220
-
221
-
222
-
223
-
224
-
225
-
226
-
227
-
228
-
229
-
230
-
231
-
232
-
233
-
234
-
235
-
236
-
237
-
238
-
239
-
240
-
241
-
242
-
243
-
244
-
245
-
246
-
247
-
248
-
249
-
250
-
251
-
252
-
253
-
254
-
255
-
256
-
257
-
258
-
259
-
260
-
261
-
262
-
263
 |
 |

157
Management Report
132 Audi Group
141 Business and underlying
situation
141 Economic environment
143 Research and development
147 Procurement
148 Production
150 Deliveries and distribution
156 Financial performance
indicators
156 Financial performance
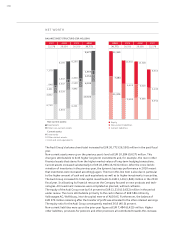
158 Net worth
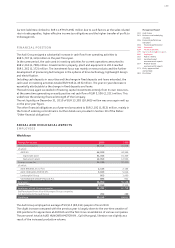
159 Financial position
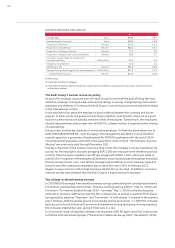
159 Social and ecological aspects
173 Risks, opportunities
and outlook
183 Disclaimer
The other operating result was improved to EUR 1,017 (852) million in 2010.
The Audi Group therefore more than doubled its operating profit in the past fiscal year, with the
figure of EUR 3,340 (1,604) million the highest operating profit in its history. This keeps the
Company emphatically on the course of growth that it has been following for the past few years.
The financial result almost matched the previous year’s figure, at EUR 293 (324) million. It was
diminished in particular by the lower market interest rate for cash and cash equivalents invested.
On the other hand, the investment result performed very positively.
DEVELOPMENT OF PROFIT BEFORE TAX AND RETURN ON SALES BEFORE TAX
200820072006
3,000
2,000
1,000
0
3,634
10.3
3,177
9.3
2,915
8.7
1,946
6.2
20102009
1,928
6.5
Profit before tax
(EUR million)
Return on sales before tax
(%)
In all, the Audi Group therefore improved its profit before tax by 88.5 percent to EUR 3,634
(1,928) million. After deduction of income tax expense, the Company posted a profit after tax of
EUR 2,630 (1,347) million for the period under review, an increase of 95.2 percent.
KEY EARNINGS DATA
% 2010 2009
Operating return on sales 9.4 5.4
Return on sales before tax 10.3 6.5
Equity return after tax 24.0 12.9
Return on investment 24.7 11.5
The Company’s high profitability is also reflected in all key return ratios.
For example, the Audi Group increased its operating return on sales to 9.4 (5.4) percent and its
return on sales before tax to 10.3 (6.5) percent in the past fiscal year. The Company’s return on
investment over the same period was an impressive 24.7 (11.5) percent. This meant the Audi
Group was again one of the most profitable premium-segment automotive manufacturers in the
world in 2010.