Audi 2010 Annual Report Download - page 218
Download and view the complete annual report
Please find page 218 of the 2010 Audi annual report below. You can navigate through the pages in the report by either clicking on the pages listed below, or by using the keyword search tool below to find specific information within the annual report.-
 1
1 -
2
-
3
-
4
-
5
-
6
-
7
-
8
-
9
-
10
-
11
-
12
-
13
-
14
-
15
-
16
-
17
-
18
-
19
-
20
-
21
-
22
-
23
-
24
-
25
-
26
-
27
-
28
-
29
-
30
-
31
-
32
-
33
-
34
-
35
-
36
-
37
-
38
-
39
-
40
-
41
-
42
-
43
-
44
-
45
-
46
-
47
-
48
-
49
-
50
-
51
-
52
-
53
-
54
-
55
-
56
-
57
-
58
-
59
-
60
-
61
-
62
-
63
-
64
-
65
-
66
-
67
-
68
-
69
-
70
-
71
-
72
-
73
-
74
-
75
-
76
-
77
-
78
-
79
-
80
-
81
-
82
-
83
-
84
-
85
-
86
-
87
-
88
-
89
-
90
-
91
-
92
-
93
-
94
-
95
-
96
-
97
-
98
-
99
-
100
-
101
-
102
-
103
-
104
-
105
-
106
-
107
-
108
-
109
-
110
-
111
-
112
-
113
-
114
-
115
-
116
-
117
-
118
-
119
-
120
-
121
-
122
-
123
-
124
-
125
-
126
-
127
-
128
-
129
-
130
-
131
-
132
-
133
-
134
-
135
-
136
-
137
-
138
-
139
-
140
-
141
-
142
-
143
-
144
-
145
-
146
-
147
-
148
-
149
-
150
-
151
-
152
-
153
-
154
-
155
-
156
-
157
-
158
-
159
-
160
-
161
-
162
-
163
-
164
-
165
-
166
-
167
-
168
-
169
-
170
-
171
-
172
-
173
-
174
-
175
-
176
-
177
-
178
-
179
-
180
-
181
-
182
-
183
-
184
-
185
-
186
-
187
-
188
-
189
-
190
-
191
-
192
-
193
-
194
-
195
-
196
-
197
-
198
-
199
-
200
-
201
-
202
-
203
-
204
-
205
-
206
-
207
-
 208
208 -
 209
209 -
 210
210 -
 211
211 -
 212
212 -
 213
213 -
 214
214 -
 215
215 -
 216
216 -
 217
217 -
 218
218 -
 219
219 -
 220
220 -
 221
221 -
 222
222 -
 223
223 -
 224
224 -
 225
225 -
 226
226 -
 227
227 -
 228
228 -
229
-
230
-
231
-
232
-
233
-
234
-
235
-
236
-
237
-
238
-
239
-
240
-
241
-
242
-
243
-
244
-
245
-
246
-
247
-
248
-
249
-
250
-
251
-
252
-
253
-
254
-
255
-
256
-
257
-
258
-
259
-
260
-
261
-
262
-
263
 |
 |
216
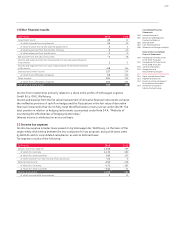
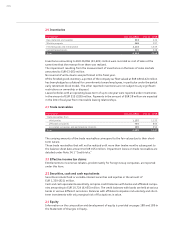
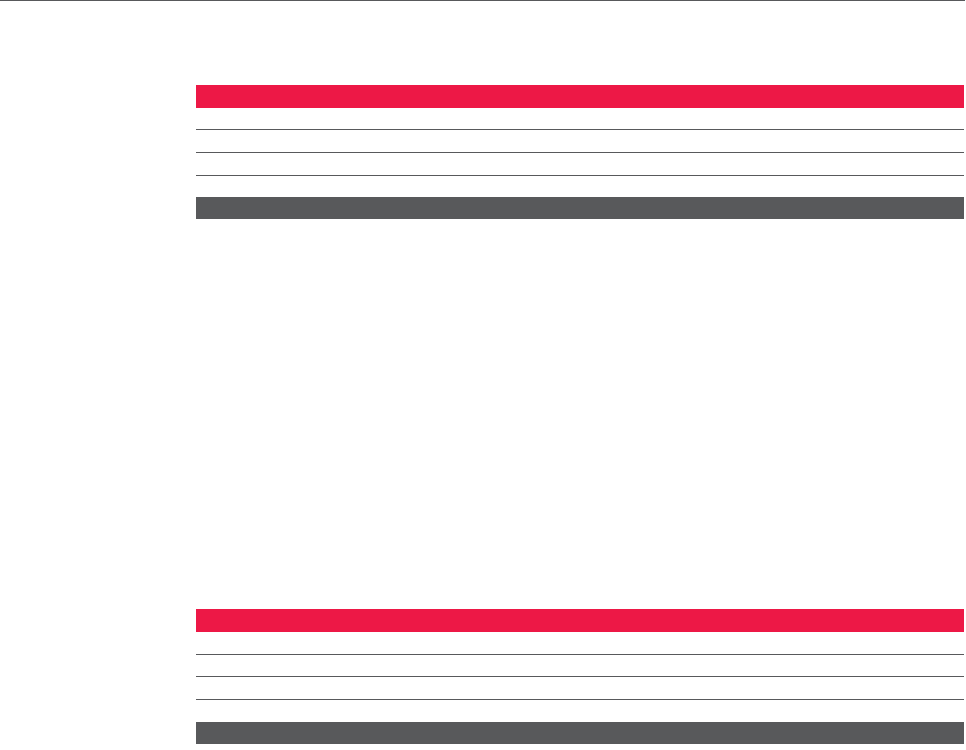
20 Inventories
EUR million Dec. 31, 2010 Dec. 31, 2009
Raw materials and supplies 353 324
Work in progress 368 297
Finished goods and merchandise 2,118 1,619
Current leased assets 515 328
Total 3,354 2,568
Inventories amounting to EUR 26,866 (23,401) million were recorded as cost of sales at the
same time that the revenue from them was realized.
The impairment resulting from the measurement of inventories on the basis of sales markets
amounted to EUR 63 (83) million.
No reversal of write-downs was performed in the fiscal year.
Of the finished goods inventory, a portion of the company car fleet valued at EUR 180 (142) million
has been pledged as collateral for commitments toward employees, in particular under the partial
early retirement block model. The other reported inventories are not subject to any significant
restrictions on ownership or disposal.
Leased vehicles with an operating lease term of up to one year were reported under inventories
in the amount of EUR 515 (328) million. Payments in the amount of EUR 38 million are expected
in the 2011 fiscal year from irrevocable leasing relationships.
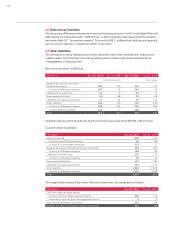
21 Trade receivables
EUR million Dec. 31, 2010 Dec. 31, 2009
Trade receivables from
third parties 1,155 1,125
affiliated companies 755 803
associated companies and participating interests 189 353
Total 2,099 2,281
The carrying amounts of the trade receivables correspond to the fair values due to their short-
term nature.
Those trade receivables that will not be realized until more than twelve months subsequent to
the balance sheet date amount to EUR 0 (5) million. Impairment losses on trade receivables are
detailed under Note 34.1 “Credit risks.”
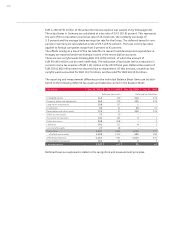
22 Effective income tax claims
Entitlements to income tax rebates, predominantly for foreign Group companies, are reported
under this item.
23 Securities, cash and cash equivalents
Securities include fixed or variable-interest securities and equities in the amount of
EUR 1,339 (821) million.
Cash and cash equivalents essentially comprise credit balances with banks and affiliated compa-
nies amounting to EUR 10,724 (6,455) million. The credit balances with banks are held at various
banks in various different currencies. Balances with affiliated companies include daily and short-
term investments with only marginal risk of fluctuations in value.
24 Equity
Information on the composition and development of equity is provided on pages 188 and 189 in
the Statement of Changes in Equity.