Audi 2010 Annual Report Download - page 2
Download and view the complete annual report
Please find page 2 of the 2010 Audi annual report below. You can navigate through the pages in the report by either clicking on the pages listed below, or by using the keyword search tool below to find specific information within the annual report.-
 1
1 -
 2
2 -
 3
3 -
 4
4 -
 5
5 -
 6
6 -
 7
7 -
 8
8 -
 9
9 -
 10
10 -
 11
11 -
 12
12 -
 13
13 -
14
-
15
-
16
-
17
-
18
-
19
-
20
-
21
-
22
-
23
-
24
-
25
-
26
-
27
-
28
-
29
-
30
-
31
-
32
-
33
-
34
-
35
-
36
-
37
-
38
-
39
-
40
-
41
-
42
-
43
-
44
-
45
-
46
-
47
-
48
-
49
-
50
-
51
-
52
-
53
-
54
-
55
-
56
-
57
-
58
-
59
-
60
-
61
-
62
-
63
-
64
-
65
-
66
-
67
-
68
-
69
-
70
-
71
-
72
-
73
-
74
-
75
-
76
-
77
-
78
-
79
-
80
-
81
-
82
-
83
-
84
-
85
-
86
-
87
-
88
-
89
-
90
-
91
-
92
-
93
-
94
-
95
-
96
-
97
-
98
-
99
-
100
-
101
-
102
-
103
-
104
-
105
-
106
-
107
-
108
-
109
-
110
-
111
-
112
-
113
-
114
-
115
-
116
-
117
-
118
-
119
-
120
-
121
-
122
-
123
-
124
-
125
-
126
-
127
-
128
-
129
-
130
-
131
-
132
-
133
-
134
-
135
-
136
-
137
-
138
-
139
-
140
-
141
-
142
-
143
-
144
-
145
-
146
-
147
-
148
-
149
-
150
-
151
-
152
-
153
-
154
-
155
-
156
-
157
-
158
-
159
-
160
-
161
-
162
-
163
-
164
-
165
-
166
-
167
-
168
-
169
-
170
-
171
-
172
-
173
-
174
-
175
-
176
-
177
-
178
-
179
-
180
-
181
-
182
-
183
-
184
-
185
-
186
-
187
-
188
-
189
-
190
-
191
-
192
-
193
-
194
-
195
-
196
-
197
-
198
-
199
-
200
-
201
-
202
-
203
-
204
-
205
-
206
-
207
-
208
-
209
-
210
-
211
-
212
-
213
-
214
-
215
-
216
-
217
-
218
-
219
-
220
-
221
-
222
-
223
-
224
-
225
-
226
-
227
-
228
-
229
-
230
-
231
-
232
-
233
-
234
-
235
-
236
-
237
-
238
-
239
-
240
-
241
-
242
-
243
-
244
-
245
-
246
-
247
-
248
-
249
-
250
-
251
-
252
-
253
-
254
-
255
-
256
-
257
-
258
-
259
-
260
-
261
-
262
-
263
 |
 |
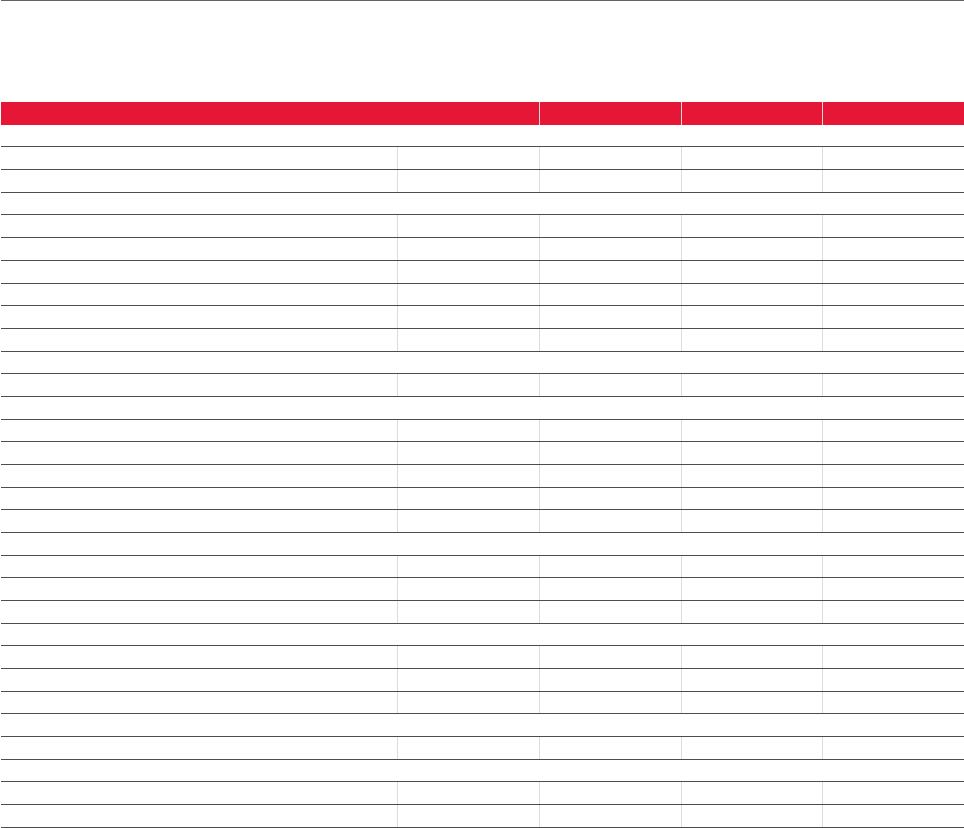
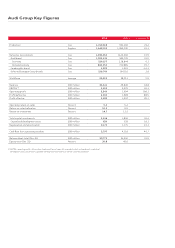
Audi Group Key Figures
2010 2009 Change in %
Production Cars 1,150,018 932,260 23.4
Engines 1,648,193 1,384,240 19.1
Deliveries to customers Cars 1,293,453 1,145,360 12.9
Audi brand Cars 1,092,411 949,729 15.0
Germany Cars 229,157 228,844 0.1
Outside Germany Cars 863,254 720,885 19.7
Lamborghini brand Cars 1,302 1,515 –14.1
Other Volkswagen Group brands Cars 199,740 194,116 2.9
Workforce Average 59,513 58,011 2.6
Revenue EUR million 35,441 29,840 18.8
EBITDA 1) EUR million 5,452 3,379 61.3
Operating profit EUR million 3,340 1,604 108.2
Profit before tax EUR million 3,634 1,928 88.5
Profit after tax EUR million 2,630 1,347 95.2
Operating return on sales Percent 9.4 5.4
Return on sales before tax Percent 10.3 6.5
Return on investment Percent 24.7 11.5
Total capital investments EUR million 2,146 1,844 16.4
Capitalized development costs EUR million 630 528 19.2
Depreciation and amortization EUR million 2,170 1,775 22.2
Cash flow from operating activities EUR million 5,797 4,119 40.7
Balance sheet total (Dec. 31) EUR million 30,772 26,550 15.9
Equity ratio (Dec. 31) Percent 36.8 40.0
1) EBITDA = operating profit + balance from impairment losses (reversals) on property, plant and equipment, capitalized
development costs, leased assets, goodwill and long-term investments as per the Cash Flow Statement