Audi 2010 Annual Report Download - page 223
Download and view the complete annual report
Please find page 223 of the 2010 Audi annual report below. You can navigate through the pages in the report by either clicking on the pages listed below, or by using the keyword search tool below to find specific information within the annual report.-
 1
1 -
2
-
3
-
4
-
5
-
6
-
7
-
8
-
9
-
10
-
11
-
12
-
13
-
14
-
15
-
16
-
17
-
18
-
19
-
20
-
21
-
22
-
23
-
24
-
25
-
26
-
27
-
28
-
29
-
30
-
31
-
32
-
33
-
34
-
35
-
36
-
37
-
38
-
39
-
40
-
41
-
42
-
43
-
44
-
45
-
46
-
47
-
48
-
49
-
50
-
51
-
52
-
53
-
54
-
55
-
56
-
57
-
58
-
59
-
60
-
61
-
62
-
63
-
64
-
65
-
66
-
67
-
68
-
69
-
70
-
71
-
72
-
73
-
74
-
75
-
76
-
77
-
78
-
79
-
80
-
81
-
82
-
83
-
84
-
85
-
86
-
87
-
88
-
89
-
90
-
91
-
92
-
93
-
94
-
95
-
96
-
97
-
98
-
99
-
100
-
101
-
102
-
103
-
104
-
105
-
106
-
107
-
108
-
109
-
110
-
111
-
112
-
113
-
114
-
115
-
116
-
117
-
118
-
119
-
120
-
121
-
122
-
123
-
124
-
125
-
126
-
127
-
128
-
129
-
130
-
131
-
132
-
133
-
134
-
135
-
136
-
137
-
138
-
139
-
140
-
141
-
142
-
143
-
144
-
145
-
146
-
147
-
148
-
149
-
150
-
151
-
152
-
153
-
154
-
155
-
156
-
157
-
158
-
159
-
160
-
161
-
162
-
163
-
164
-
165
-
166
-
167
-
168
-
169
-
170
-
171
-
172
-
173
-
174
-
175
-
176
-
177
-
178
-
179
-
180
-
181
-
182
-
183
-
184
-
185
-
186
-
187
-
188
-
189
-
190
-
191
-
192
-
193
-
194
-
195
-
196
-
197
-
198
-
199
-
200
-
201
-
202
-
203
-
204
-
205
-
206
-
207
-
208
-
209
-
210
-
211
-
212
-
 213
213 -
 214
214 -
 215
215 -
 216
216 -
 217
217 -
 218
218 -
 219
219 -
 220
220 -
 221
221 -
 222
222 -
 223
223 -
 224
224 -
 225
225 -
 226
226 -
 227
227 -
 228
228 -
 229
229 -
 230
230 -
 231
231 -
 232
232 -
 233
233 -
234
-
235
-
236
-
237
-
238
-
239
-
240
-
241
-
242
-
243
-
244
-
245
-
246
-
247
-
248
-
249
-
250
-
251
-
252
-
253
-
254
-
255
-
256
-
257
-
258
-
259
-
260
-
261
-
262
-
263
 |
 |
221
Consolidated Financial
Statements
184 Income Statement
185 Statement of Recognized
Income and Expense
186 Balance Sheet
187 Cash Flow Statement
188 Statement of Changes in Equity
Notes to the Consolidated
Financial Statements
190 Development of fixed assets
in the 2010 fiscal year
192 Development of fixed assets
in the 2009 fiscal year
194 General information
200 Recognition and
measurement principles
207 Notes to the Income Statement
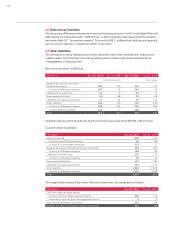
214 Notes to the Balance Sheet
217 Liabilities
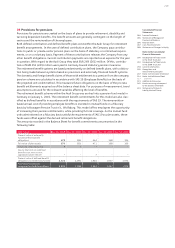
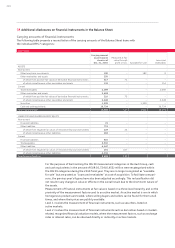
223 Additional disclosures
242 Events occurring subsequent
to the balance sheet date
243 Statement of Interests
held by the Audi Group
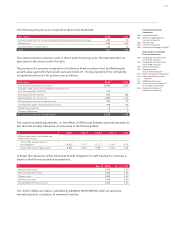
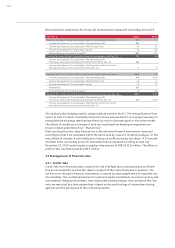
The following amounts were recognized in the Income Statement:
EUR million 2010 2009
Current service cost for services provided by the employees in the fiscal year – 80 – 74
Interest cost – 142 – 135
Expected return on plan assets 30 24
Total – 192 – 185
The interest element in pension costs is shown under financing costs. The expected return on
plan assets is also shown under this item.
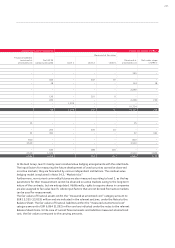
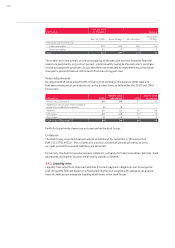
The provisions for pensions recognized in the Balance Sheet are determined by offsetting the
present value against the fund assets pursuant to IAS 19. The development of the net liability
recognized as provisions for pensions was as follows:
EUR million 2010 2009
Provisions for pensions on January 1 2,098 1,946
Changes in the group of consolidated companies and
first-time adoption of IAS 19 12 –
Employee benefit expenses 192 185
Actuarial gains (–) / losses (+) + 186 + 113
Pension payments from company assets – 87 – 79
Contributions paid to external pension funds – 68 – 64
Effects from transfers – 2– 1
Currency differences 10
Provisions for pensions on December 31 2,331 2,098
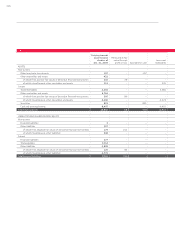
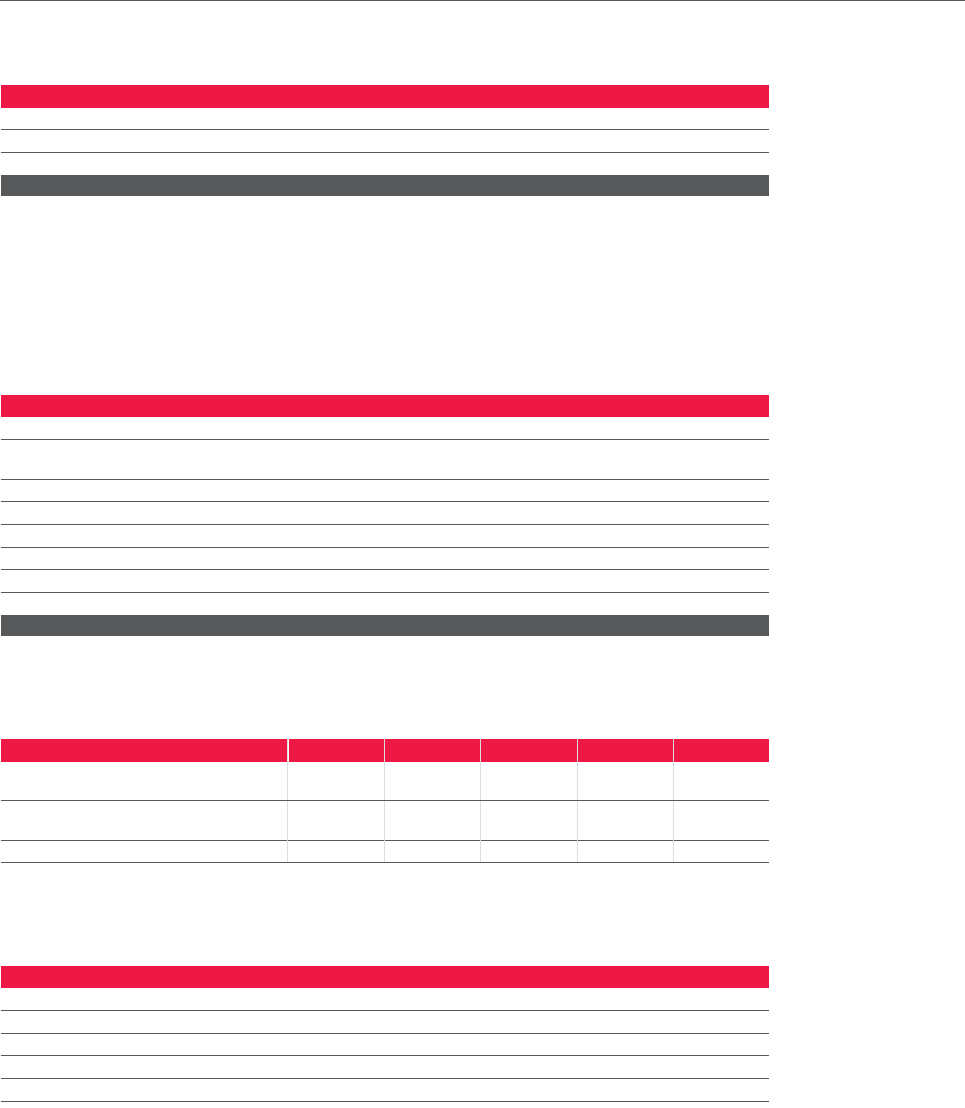
The experience-based adjustments, i.e. the effects of differences between actuarial assumptions
and what has actually transpired, are presented in the following table:
% 2010 2009 2008 2007 2006
Difference between anticipated and
actual performance
as % of the present value of
the obligation – 0.31 1.37 0.17 – 1.46 0.29
as % of fair value of plan assets 0.84 – 4.86 – 9.88 – 5.26 1.65
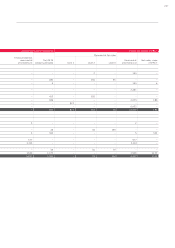
In detail, the calculation of the retirement benefit obligation for staff employed in Germany is
based on the following actuarial assumptions:
% Dec. 31, 2010 Dec. 31, 2009
Remuneration trend 2.70 2.50
Retirement benefit trend 1.60 1.60
Discount rate 4.90 5.40
Staff turnover rate 1.00 1.00
Anticipated yield on plan assets 4.25 5.00
The “2005 G Reference Tables” published by HEUBECK-RICHTTAFELN-GmbH served as the
biometric basis for calculation of retirement benefits.