Audi 2010 Annual Report Download - page 158
Download and view the complete annual report
Please find page 158 of the 2010 Audi annual report below. You can navigate through the pages in the report by either clicking on the pages listed below, or by using the keyword search tool below to find specific information within the annual report.-
 1
1 -
2
-
3
-
4
-
5
-
6
-
7
-
8
-
9
-
10
-
11
-
12
-
13
-
14
-
15
-
16
-
17
-
18
-
19
-
20
-
21
-
22
-
23
-
24
-
25
-
26
-
27
-
28
-
29
-
30
-
31
-
32
-
33
-
34
-
35
-
36
-
37
-
38
-
39
-
40
-
41
-
42
-
43
-
44
-
45
-
46
-
47
-
48
-
49
-
50
-
51
-
52
-
53
-
54
-
55
-
56
-
57
-
58
-
59
-
60
-
61
-
62
-
63
-
64
-
65
-
66
-
67
-
68
-
69
-
70
-
71
-
72
-
73
-
74
-
75
-
76
-
77
-
78
-
79
-
80
-
81
-
82
-
83
-
84
-
85
-
86
-
87
-
88
-
89
-
90
-
91
-
92
-
93
-
94
-
95
-
96
-
97
-
98
-
99
-
100
-
101
-
102
-
103
-
104
-
105
-
106
-
107
-
108
-
109
-
110
-
111
-
112
-
113
-
114
-
115
-
116
-
117
-
118
-
119
-
120
-
121
-
122
-
123
-
124
-
125
-
126
-
127
-
128
-
129
-
130
-
131
-
132
-
133
-
134
-
135
-
136
-
137
-
138
-
139
-
140
-
141
-
142
-
143
-
144
-
145
-
146
-
147
-
 148
148 -
 149
149 -
 150
150 -
 151
151 -
 152
152 -
 153
153 -
 154
154 -
 155
155 -
 156
156 -
 157
157 -
 158
158 -
 159
159 -
 160
160 -
 161
161 -
 162
162 -
 163
163 -
 164
164 -
 165
165 -
 166
166 -
 167
167 -
 168
168 -
169
-
170
-
171
-
172
-
173
-
174
-
175
-
176
-
177
-
178
-
179
-
180
-
181
-
182
-
183
-
184
-
185
-
186
-
187
-
188
-
189
-
190
-
191
-
192
-
193
-
194
-
195
-
196
-
197
-
198
-
199
-
200
-
201
-
202
-
203
-
204
-
205
-
206
-
207
-
208
-
209
-
210
-
211
-
212
-
213
-
214
-
215
-
216
-
217
-
218
-
219
-
220
-
221
-
222
-
223
-
224
-
225
-
226
-
227
-
228
-
229
-
230
-
231
-
232
-
233
-
234
-
235
-
236
-
237
-
238
-
239
-
240
-
241
-
242
-
243
-
244
-
245
-
246
-
247
-
248
-
249
-
250
-
251
-
252
-
253
-
254
-
255
-
256
-
257
-
258
-
259
-
260
-
261
-
262
-
263
 |
 |

156
Other Volkswagen Group brands
In the 2010 fiscal year 199,740 (194,116) vehicles of other Volkswagen Group brands were
delivered to customers by the sales companies VOLKSWAGEN GROUP ITALIA S.P.A., Verona
(Italy), Audi Volkswagen Korea Ltd., Seoul (South Korea), and Audi Volkswagen Middle East FZE,
Dubai (United Arab Emirates).
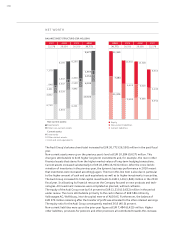
FINANCIAL PERFORMANCE INDICATORS
FINANCIAL PERFORMANCE
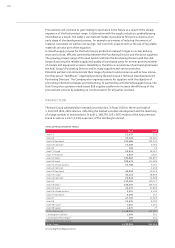
The Audi Group increased its revenue by 18.8 percent to EUR 35,441 (29,840) million in fiscal
2010 – the highest level in the Company’s history, which now goes back over a century. Increased
vehicle sales and higher revenue from sales of engines were the main factors behind this positive
development.
The Company increased revenue brought in by sales of Audi brand cars by 21.1 percent to
EUR 27,423 (22,652) million.
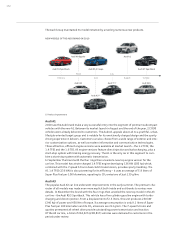
Thanks to high demand, the Audi A4 car line reasserted its position as the revenue mainstay.
Meanwhile there was a substantial boost to revenue from increased unit sales of the A5 and Q5
models. These two car lines thus successfully carved out a place in the Audi brand’s portfolio.
Following the gradual market launch of the new-generation A8 model, revenue from the luxury
sedan was more than doubled. The revenue realized from sales of the Audi Q7 in particular also
developed highly satisfactorily.
The two new models Audi A1 and A7 Sportback only appeared on individual markets from the
third and fourth quarters respectively. The high level of demand that they generated is already
reflected in the extremely positive development in revenue.
Revenue for the Lamborghini brand reached the previous year’s level. In addition to models of
the Audi and Lamborghini brands, the Audi Group sells vehicles of the Bentley, SEAT, Škoda, VW
Passenger Car and VW Commercial Vehicle brands through the sales subsidiaries VOLKSWAGEN
GROUP ITALIA S.P.A., Verona (Italy), Audi Volkswagen Korea Ltd., Seoul (South Korea), and Audi
Volkswagen Middle East FZE, Dubai (United Arab Emirates). Revenue from the trading of these
brands rose in line with the increased demand that they enjoyed.
The cost of sales increased to EUR 29,706 (25,649) million in the past fiscal year as a result of the
dynamic business performance. However, thanks to the positive effects of further productivity
advances and process improvements, this rise of 15.8 percent was below the rate of increase in
revenue.
The Audi Group thus generated a gross profit of EUR 5,735 (4,191) million, 36.8 percent more
than in the previous year.
The Audi Group succeeded in reducing distribution costs to EUR 3,038 (3,138) million in the
past fiscal year, a drop of 3.2 percent, despite the substantially higher volume and numerous
market launches. Lower costs from residual value risks were one of the determining factors. The
rise in administrative expenses to EUR 374 (301) million was largely attributable to the first-
time consolidation of various companies.