Audi 2010 Annual Report Download - page 209
Download and view the complete annual report
Please find page 209 of the 2010 Audi annual report below. You can navigate through the pages in the report by either clicking on the pages listed below, or by using the keyword search tool below to find specific information within the annual report.-
 1
1 -
2
-
3
-
4
-
5
-
6
-
7
-
8
-
9
-
10
-
11
-
12
-
13
-
14
-
15
-
16
-
17
-
18
-
19
-
20
-
21
-
22
-
23
-
24
-
25
-
26
-
27
-
28
-
29
-
30
-
31
-
32
-
33
-
34
-
35
-
36
-
37
-
38
-
39
-
40
-
41
-
42
-
43
-
44
-
45
-
46
-
47
-
48
-
49
-
50
-
51
-
52
-
53
-
54
-
55
-
56
-
57
-
58
-
59
-
60
-
61
-
62
-
63
-
64
-
65
-
66
-
67
-
68
-
69
-
70
-
71
-
72
-
73
-
74
-
75
-
76
-
77
-
78
-
79
-
80
-
81
-
82
-
83
-
84
-
85
-
86
-
87
-
88
-
89
-
90
-
91
-
92
-
93
-
94
-
95
-
96
-
97
-
98
-
99
-
100
-
101
-
102
-
103
-
104
-
105
-
106
-
107
-
108
-
109
-
110
-
111
-
112
-
113
-
114
-
115
-
116
-
117
-
118
-
119
-
120
-
121
-
122
-
123
-
124
-
125
-
126
-
127
-
128
-
129
-
130
-
131
-
132
-
133
-
134
-
135
-
136
-
137
-
138
-
139
-
140
-
141
-
142
-
143
-
144
-
145
-
146
-
147
-
148
-
149
-
150
-
151
-
152
-
153
-
154
-
155
-
156
-
157
-
158
-
159
-
160
-
161
-
162
-
163
-
164
-
165
-
166
-
167
-
168
-
169
-
170
-
171
-
172
-
173
-
174
-
175
-
176
-
177
-
178
-
179
-
180
-
181
-
182
-
183
-
184
-
185
-
186
-
187
-
188
-
189
-
190
-
191
-
192
-
193
-
194
-
195
-
196
-
197
-
198
-
 199
199 -
 200
200 -
 201
201 -
 202
202 -
 203
203 -
 204
204 -
 205
205 -
 206
206 -
 207
207 -
 208
208 -
 209
209 -
 210
210 -
 211
211 -
 212
212 -
 213
213 -
 214
214 -
 215
215 -
 216
216 -
 217
217 -
 218
218 -
 219
219 -
220
-
221
-
222
-
223
-
224
-
225
-
226
-
227
-
228
-
229
-
230
-
231
-
232
-
233
-
234
-
235
-
236
-
237
-
238
-
239
-
240
-
241
-
242
-
243
-
244
-
245
-
246
-
247
-
248
-
249
-
250
-
251
-
252
-
253
-
254
-
255
-
256
-
257
-
258
-
259
-
260
-
261
-
262
-
263
 |
 |

207
Consolidated Financial
Statements
184 Income Statement
185 Statement of Recognized
Income and Expense
186 Balance Sheet
187 Cash Flow Statement
188 Statement of Changes in Equity
Notes to the Consolidated
Financial Statements
190 Development of fixed assets
in the 2010 fiscal year
192 Development of fixed assets
in the 2009 fiscal year
194 General information
200 Recognition and
measurement principles
200 Recognition of income
and expenses
200 Intangible assets
201 Property, plant
and equipment
201 Investment property
202 Investments accounted for
using the equity method
202 Impairment tests
202 Financial instruments
204 Other receivables and
financial assets
205 Deferred tax
205 Inventories
205 Securities, cash and
cash equivalents
206 Provisions for pensions
206 Other provisions
206 Management’s estimates
and assessments
207 Notes to the Income Statement
214 Notes to the Balance Sheet
223 Additional disclosures
242 Events occurring subsequent
to the balance sheet date
243 Statement of Interests
held by the Audi Group
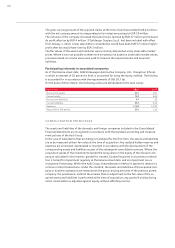
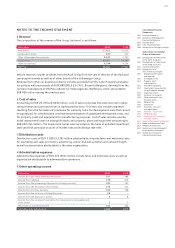
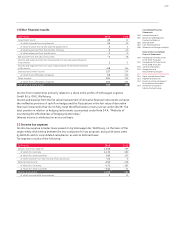
NOTES TO THE INCOME STATEMENT
1 Revenue
The composition of the revenue of the Group, by brand, is as follows:
EUR million 2010 2009
Audi brand 27,423 22,652
Lamborghini brand 227 227
Other Volkswagen Group brands 3,047 2,707
Vehicle sales 30,697 25,586
Other car business 4,744 4,254
Revenue 35,441 29,840
Vehicle revenue includes proceeds from the Audi Group from the sale of vehicles of the Audi and
Lamborghini brands as well as of other brands of the Volkswagen Group.
Revenue from other car business primarily includes proceeds from the sale of engines and genu-
ine parts as well as proceeds of AUDI BRUSSELS S.A./N.V., Brussels (Belgium), deriving from the
contract manufacture of VW Polo vehicles for Volkswagen AG, Wolfsburg, which amounted to
EUR 456 million during the previous year.
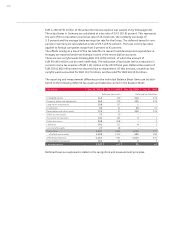
2 Cost of sales
Amounting to EUR 29,706 (25,649) million, cost of sales comprises the costs incurred in gene-
rating revenue and purchase prices in trading transactions. This item also includes expenses
resulting from the formation of provisions for warranty costs, for development costs that cannot
be capitalized, for scheduled and unscheduled amortization of capitalized development costs, and
for property, plant and equipment for manufacturing purposes. Cost of sales includes unsche-
duled impairment losses on intangible assets and property, plant and equipment amounting to
EUR 463 (72) million. The impairment losses were recorded on the basis of updated impairment
tests and took particular account of market risks and exchange rate risks.
3 Distribution costs
Distribution costs of EUR 3,038 (3,138) million substantially comprise labor and materials costs
for marketing and sales promotion, advertising, public relations activities and outward freight,
as well as depreciation attributable to the sales organization.
4 Administrative expenses
Administrative expenses of EUR 374 (301) million include labor and materials costs, as well as
depreciation attributable to administrative operations.
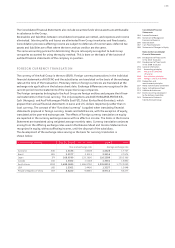
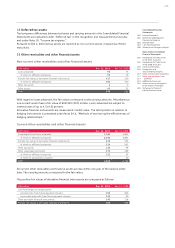
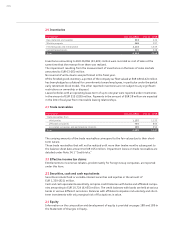
5 Other operating income
EUR million 2010 2009
Income from derivative hedging transactions 297 488
Income from rebilling 379 325
Income from the processing of payments in foreign currency 181 137
Income from the dissolution of provisions 174 125
Income from ancillary business 162 128
Income from the write-up of intangible assets 58 –
Income from the disposal of assets 68
Income from the reversal of reductions for impairment on receivables and
other assets 32
Miscellaneous operating income 423 261
Total other operating income 1,684 1,475