Audi 2010 Annual Report Download - page 217
Download and view the complete annual report
Please find page 217 of the 2010 Audi annual report below. You can navigate through the pages in the report by either clicking on the pages listed below, or by using the keyword search tool below to find specific information within the annual report.-
 1
1 -
2
-
3
-
4
-
5
-
6
-
7
-
8
-
9
-
10
-
11
-
12
-
13
-
14
-
15
-
16
-
17
-
18
-
19
-
20
-
21
-
22
-
23
-
24
-
25
-
26
-
27
-
28
-
29
-
30
-
31
-
32
-
33
-
34
-
35
-
36
-
37
-
38
-
39
-
40
-
41
-
42
-
43
-
44
-
45
-
46
-
47
-
48
-
49
-
50
-
51
-
52
-
53
-
54
-
55
-
56
-
57
-
58
-
59
-
60
-
61
-
62
-
63
-
64
-
65
-
66
-
67
-
68
-
69
-
70
-
71
-
72
-
73
-
74
-
75
-
76
-
77
-
78
-
79
-
80
-
81
-
82
-
83
-
84
-
85
-
86
-
87
-
88
-
89
-
90
-
91
-
92
-
93
-
94
-
95
-
96
-
97
-
98
-
99
-
100
-
101
-
102
-
103
-
104
-
105
-
106
-
107
-
108
-
109
-
110
-
111
-
112
-
113
-
114
-
115
-
116
-
117
-
118
-
119
-
120
-
121
-
122
-
123
-
124
-
125
-
126
-
127
-
128
-
129
-
130
-
131
-
132
-
133
-
134
-
135
-
136
-
137
-
138
-
139
-
140
-
141
-
142
-
143
-
144
-
145
-
146
-
147
-
148
-
149
-
150
-
151
-
152
-
153
-
154
-
155
-
156
-
157
-
158
-
159
-
160
-
161
-
162
-
163
-
164
-
165
-
166
-
167
-
168
-
169
-
170
-
171
-
172
-
173
-
174
-
175
-
176
-
177
-
178
-
179
-
180
-
181
-
182
-
183
-
184
-
185
-
186
-
187
-
188
-
189
-
190
-
191
-
192
-
193
-
194
-
195
-
196
-
197
-
198
-
199
-
200
-
201
-
202
-
203
-
204
-
205
-
206
-
 207
207 -
 208
208 -
 209
209 -
 210
210 -
 211
211 -
 212
212 -
 213
213 -
 214
214 -
 215
215 -
 216
216 -
 217
217 -
 218
218 -
 219
219 -
 220
220 -
 221
221 -
 222
222 -
 223
223 -
 224
224 -
 225
225 -
 226
226 -
 227
227 -
228
-
229
-
230
-
231
-
232
-
233
-
234
-
235
-
236
-
237
-
238
-
239
-
240
-
241
-
242
-
243
-
244
-
245
-
246
-
247
-
248
-
249
-
250
-
251
-
252
-
253
-
254
-
255
-
256
-
257
-
258
-
259
-
260
-
261
-
262
-
263
 |
 |

215
Consolidated Financial
Statements
184 Income Statement
185 Statement of Recognized
Income and Expense
186 Balance Sheet
187 Cash Flow Statement
188 Statement of Changes in Equity
Notes to the Consolidated
Financial Statements
190 Development of fixed assets
in the 2010 fiscal year
192 Development of fixed assets
in the 2009 fiscal year
194 General information
200 Recognition and
measurement principles
207 Notes to the Income Statement
214 Notes to the Balance Sheet
217 Liabilities
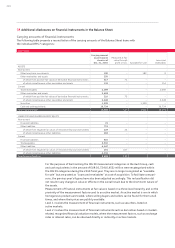
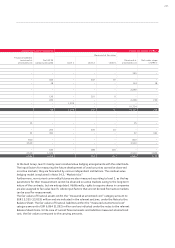
223 Additional disclosures
242 Events occurring subsequent
to the balance sheet date
243 Statement of Interests
held by the Audi Group
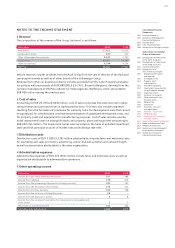
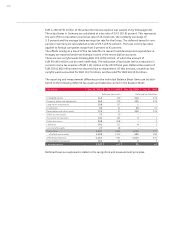
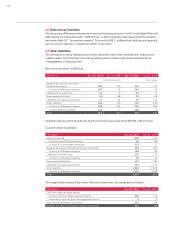
18 Deferred tax assets
The temporary differences between tax bases and carrying amounts in the Consolidated Financial
Statements are explained under “Deferred tax” in the recognition and measurement principles,
and under Note 10, “Income tax expense.”
Pursuant to IAS 1, deferred tax assets are reported as non-current assets, irrespective of their
maturities.
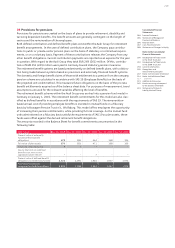
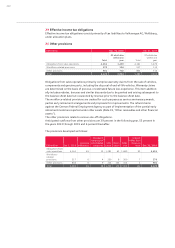
19 Other receivables and other financial assets
Non-current other receivables and other financial assets
EUR million Dec. 31, 2010 Dec. 31, 2009
Loans advanced 96 75
of which to affiliated companies 95 74
Positive fair values of derivative financial instruments 417 310
of which to affiliated companies 362 310
Other tax assets 16
Other assets 45 31
Total 560 422
With regard to loans advanced, the fair values correspond to the carrying amounts. Miscellaneous
non-current assets have a fair value of EUR 463 (347) million. Loans advanced are subject to
interest rates of up to 4.5 (4.5) percent.
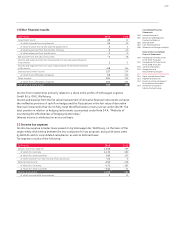
Derivative financial instruments are measured at market value. The total position in relation to
hedging instruments is presented under Note 34.4, “Methods of monitoring the effectiveness of
hedging relationships.”
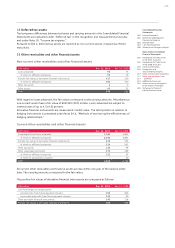
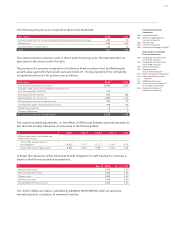
Current other receivables and other financial assets
EUR million Dec. 31, 2010 Dec. 31, 2009
Fixed deposits and loans extended 2,040 3,891
of which to affiliated companies 2,040 3,891
Positive fair values of derivative financial instruments 210 505
of which to affiliated companies 210 502
Other tax assets 135 99
Other receivables and assets 273 269
of which to affiliated companies 122 33
of which to associated companies –20
Total 2,658 4,764
All current other receivables and financial assets are due within one year of the balance sheet
date. The carrying amounts correspond to the fair values.
The positive fair values of derivative financial instruments are composed as follows:
EUR million Dec. 31, 2010 Dec. 31, 2009
Cash flow hedges to hedge against
currency risks from future payment streams 355 606
commodity price risks from future payment streams 125 90
Other derivative financial instruments 147 118
Positive fair values of derivative financial instruments 628 815